This is the Apogee Watcher changelog: a periodic summary of what we built and shipped, for anyone who wants to follow along. This changelog catches up on what we built from the start of the project through mid-January. If you're curious how Apogee Watcher is taking shape—the core platform, how we're running the product, and the first steps towards early access—here's the summary.
Origins of our development
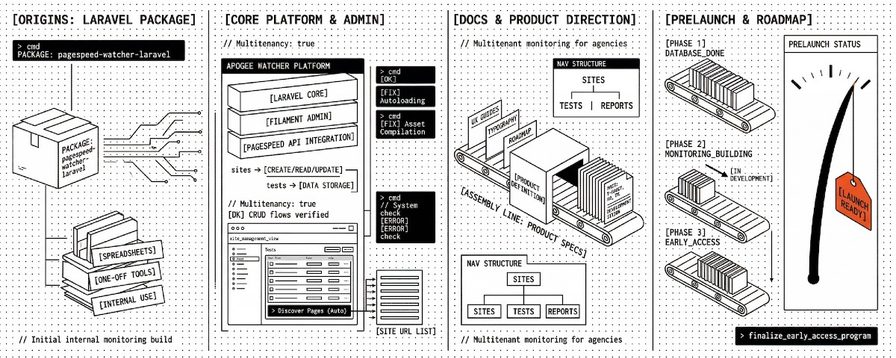
We initially built a Laravel PageSpeed Watcher package for our own internal use—to monitor our clients' sites and meet our own needs without relying on spreadsheets or one-off tools. That package became the foundation for what you see today. For more on why we started and what we're solving, see Introduction to Apogee Watcher.
Core platform and admin
We set up the project on Laravel and Filament and wired in the PageSpeed Watcher package so all monitoring logic lives in one place. The admin is built around the things you'd expect: sites, tests, and the data that supports them. We added full create, read, update, and delete flows for all of these so that once you're in, you can manage your monitored sites and their history without leaving the app. For agencies, that means one place to add clients, see test runs, and keep an eye on what's being monitored—no jumping between spreadsheets or separate tools.
We ran into a few stability issues along the way. We fixed how the codebase loads (autoloading and dependencies) and sorted out compiled assets and storage. The admin is now reliable for daily use. On the UI side we settled on a first version of our design system and a clear navigation structure so the product feels consistent and readable—important when you're in the dashboard every day. We also added an action in the site management screen that triggers automatic page discovery: when you add a site, we can help you find the pages that matter for performance instead of you listing every URL by hand. We documented how we talk to the PageSpeed API and how configuration is set up so the stack is clear for future work and for anyone who needs to debug or extend it.
Docs and product direction
We didn't want to build features in a vacuum, so we put time into documentation and product direction from day one. That includes project and database docs, a UI and branding guide (including typography), and a development review so we can track what's done and what's next. We also wrote product specs and marketing copy and made sure the welcome experience reflects what Apogee Watcher is and who it's for. The goal is that when you land on the site or open the app, you immediately understand that this is a multi-tenant PageSpeed monitoring tool built for agencies and teams that care about Core Web Vitals and client sites.
We keep an implementation roadmap that we update as we go. Phase 1—the database and core data model—is in place. Phase 2 covers the services that run monitoring and alerts; we've documented how we'll build that and how it ties into the rest of the system. The welcome page now carries Apogee Watcher messaging so visitors see what the product does and why it exists. We've also defined how the blog and product positioning fit together and how we plan to share and talk about the product, so content and growth are aligned with the build. That way the blog, landing pages, and future marketing all tell the same story.
Prelaunch and early access
We knew we wanted to run an early-access phase before a full public launch, so we laid the groundwork in this period. We wrote down the early-access plan and how it fits with the rest of the roadmap. We cleaned up the test landing page by removing pricing and sign-in blocks that weren't ready yet, so the page doesn't overpromise. We also added tooling so our own development stays consistent—for example, rules for how we use the repo so the codebase stays predictable as we add more people or automation. Boring but essential if we want to move on a schedule.
The big customer-facing addition was prelaunch leads. We added a prelaunch resource in the admin so we can create, edit, and manage leads in one place. That's the foundation for capturing interest, following up, and eventually inviting people into early access. When you sign up for the waitlist or early access, we can track that, segment it, and when the time comes, send you an invite without losing anyone in a spreadsheet. We started on blog test content and specified how we want the insight and reporting side of the product to behave later—so when we build reports and dashboards, they're built on a clear plan rather than ad hoc. Reports you can send to clients, PDFs, and trend views are all part of that vision; we're building the data and structure now so they slot in cleanly.
All of this sets us up for the next stretch: upgrading the admin to Filament v4, tightening the theme and messaging, and introducing customer plans and clearer role-based access. We'll cover that in the next changelog.