“No data” in the Chrome User Experience Report (CrUX) is not a single bug. It is a set of eligibility gates. Google only publishes field percentiles when enough opted-in Chrome sessions meet privacy and quality rules for that origin or URL. PageSpeed Insights and Search Console inherit those gaps. Lab scores from Lighthouse can still look complete on the same screen, which is why teams often treat a blank field block as a tool failure instead of an eligibility outcome.
The sections below walk those gates for client sites: when an origin is missing from CrUX entirely, when a URL is thin while the origin still has data, what to say to the client, and what to monitor until field samples exist. Keep When PageSpeed Insights Shows No CLS or INP for Your URL open for metric-level gaps on a URL that may already show other field rows. For how lab and field clocks differ, use What Are Core Web Vitals? A Practical Guide for 2026 and When to Use Synthetic vs Real User Monitoring as context.
What “no CrUX data” means on a site
CrUX is Google’s public field dataset for how real Chrome users experience popular destinations. It is also the field source behind PageSpeed Insights “Discover what your real users are experiencing” and related Search Console Core Web Vitals views. When CrUX has no data for a query, tools typically show a missing field section, an API NOT_FOUND style response, or a message that Chrome UX Report data was not found. That is different from a red or amber field category. There is no percentile to classify yet.
Agencies usually meet three patterns of “no data” that get mixed together in client chat: (1) origin absent (https://www.client.com or the wrong scheme/host variant is not in the dataset at all); (2) URL thin, origin present (the homepage or a landing path has no URL-level field rows, while origin-level field data still exists); (3) metric missing (some field metrics appear and others do not, for example LCP present and INP absent). Pattern (3) is covered in the PageSpeed Insights “no CLS or INP” guide linked above. What follows focuses on (1) and the client conversation around (2). The practical question is not whether PageSpeed Insights is broken; it is which eligibility gate failed, and what you measure until field data exists. Naming the gate early stops the team from chasing Lighthouse scores that never create field rows.
Chrome UX Report eligibility: user, origin, and page
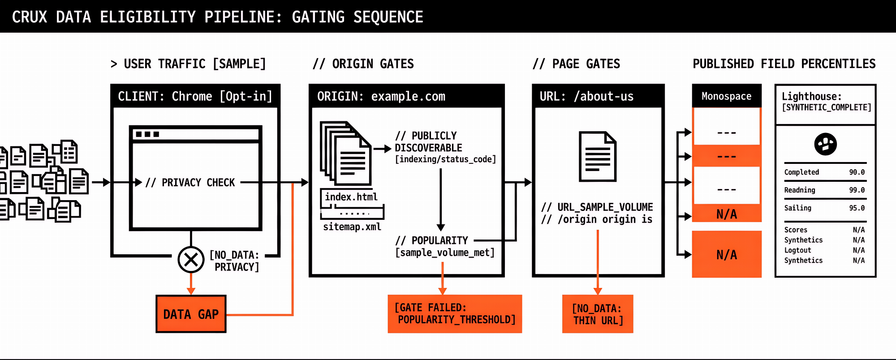
Google’s CrUX methodology describes three layers that must line up before an experience counts toward page-level field data in PageSpeed Insights and the CrUX API: the user, the origin, and the page. Experiences that meet user and origin rules but not page rules can still feed origin-level data. Pages and origins appear and disappear automatically as eligibility changes. You cannot manually submit a site for inclusion.
User eligibility means the visit came from a Chrome user whose settings allow contribution to the statistics dataset. Not every browser, privacy mode, or visitor is included. CrUX is a sample, not a full count of all traffic in analytics.
Origin eligibility needs two properties: the origin must be publicly discoverable, and it must be sufficiently popular. Discoverability is about whether the root of the origin can be treated as a public page (indexing and successful HTTP status on the root matter; blocked or failing roots are a common trap). Popularity means enough eligible experiences across the origin’s pages for Google to publish anonymised distributions. The exact threshold is not disclosed.
Page eligibility adds that the specific URL must also be popular enough for URL-level distributions. A thin blog post or campaign landing page can lack URL-level CrUX while the origin still has field data. That is expected on long-tail templates.
HTTP versus HTTPS and www versus apex are different origins. So are subdomains. https://shop.example.com does not inherit CrUX from https://www.example.com. When someone says “the client site has no CrUX data,” name the origin string you queried, including scheme and host.
Why an origin is missing from CrUX entirely
Wrong origin string. When tools say the origin is not in the Chrome UX Report, check the origin string before you promise a timeline for field data, then move on to discoverability and sample size. Teams often query http://, omit or add www, or paste a path when the API expects an origin. The CrUX API docs recommend comparing the navigable final URL after redirects with the origin you requested. A 404-style “chrome ux report data not found” response is common when the string is simply wrong.
Root not publicly discoverable. If the root redirects in a way that systems treat as undiscoverable, or if the root fails indexing / HTTP status checks, the origin can drop out even when inner URLs get traffic. Chromium discussion threads have long noted redirect-heavy roots as a reason PageSpeed Insights may show URL-level data after following a redirect while origin-level data is missing. Fix discoverability before you blame sample size alone.
Not enough eligible Chrome traffic. Small sites, brand-new launches, sites that behave like private apps, and niches with little opted-in Chrome usage may never meet popularity. Google does not publish the cut-off. In our experience, waiting a few more PageSpeed Insights refreshes does not create an origin that is structurally ineligible.
Not a ranking penalty by itself. Missing CrUX data is not the same as Search saying the site is slow. It means Google does not have enough public field evidence to publish Core Web Vitals percentiles for that origin or URL slice. Search Console may still show limited or grouped signals. Do not invent a field fail from a blank PageSpeed Insights field block.
URL-level gaps when the origin still has field data
If origin-level field data exists but the client’s main URL shows no URL-level CrUX, you are usually looking at popularity at the page layer, not a dead origin. Homepage and key templates often qualify first; checkout steps, locale paths, and campaign URLs lag. PageSpeed Insights may still show origin-level field categories while the URL field rows are empty. Label that clearly in reports so nobody presents a Core Web Vitals pass for a thin URL using only origin-level fallback.
When the gap is “this metric is missing but others appear,” use the dedicated guide for missing CLS or INP field rows. When the gap is “this URL has no field block but the origin does,” keep synthetic monitoring on that URL and wait for samples. Do not treat origin green as URL green in a client report; say which level the numbers come from.
What to tell the client when field data is unavailable
What we know. Use a short script so the conversation stays honest across accounts. CrUX has no (or incomplete) field data for [origin or URL] right now. That usually means eligibility: discoverability, traffic sample size, or the wrong host/scheme, not a broken lab test. We should confirm the origin string before we talk about traffic volume.
What we do not claim. We are not saying the page passes or fails Core Web Vitals in the field. We do not have the percentiles yet. Lab scores alone cannot fill that gap in a report to the client.
What we will watch instead. Scheduled lab tests on the homepage and other priority URLs (mobile and desktop as separate rows), with budgets and alerts, until URL-level or origin-level field data appears. We will re-check CrUX on a fixed schedule and say when field rows show up. That gives the retainer a measurable trail while field data is empty.
What we need from them. Confirm the public origin (HTTPS, www or apex), that the root is indexable, and which URLs matter for the retainer. If the root redirects oddly or blocks indexing, that is an eligibility fix, not a Lighthouse tweak. Without a correct public root, more lab runs will not create CrUX rows. Pair that script with PageSpeed Insights vs Automated Monitoring: one-off PageSpeed Insights explains a moment, and scheduled runs explain change over time when field data cannot.
What to monitor instead: synthetic budgets on priority URLs
Until field data is available, synthetic (lab) monitoring is what you can report against week to week. Pick a small URL set: homepage, primary landing templates, and checkout or lead paths. Run the same lab profile on a schedule, store history, and alert when LCP, CLS, or related lab metrics cross a budget. How to Schedule PageSpeed Monitoring covers frequency and priority across a portfolio. Synthetic versus real-user roles are spelled out in the synthetic vs RUM guide linked earlier.
Lab data will not replace field eligibility, but it stops the retainer from depending on a blank CrUX panel. When origin or URL field data appears, add it to the same report without throwing away the lab history that covered the gap. In Apogee Watcher, scheduled PageSpeed Insights–backed checks keep that lab trail across client sites while CrUX field rows are absent or partial.
FAQ
Does “CrUX no data” mean the site is slow?
No. It means Google does not have enough eligible Chrome samples (or the origin is not publicly discoverable in the way CrUX requires) to publish field percentiles. Lab tools can still diagnose the template while you wait for eligibility.
Can we force a site into the Chrome UX Report?
No. Inclusion is automatic when eligibility is met. You cannot manually submit an origin. Fix discoverability and grow real Chrome traffic, then re-check later.
Why does PageSpeed Insights show lab scores but no field section?
Lab data comes from Lighthouse on demand. Field data comes from CrUX only when eligibility passes. Both can appear on one PageSpeed Insights page, and either side can be missing independently.
Are subdomains included with the main domain?
No. Each origin is separate. https://blog.example.com needs its own eligibility. Query the origin the client actually cares about, including scheme and host.
How long until field data appears after a launch?
There is no public SLA. CrUX uses a rolling collection window and popularity thresholds. New or low-traffic origins can stay empty for a long time. Plan synthetic monitoring from day one rather than waiting for CrUX before you set budgets.
CTA
If a client site shows CrUX no data, name the origin, check discoverability and host/scheme, and say clearly that field percentiles are unavailable. Then put synthetic budgets on the priority URLs so the retainer still has numbers to report on a schedule. For metric-level PageSpeed Insights gaps, use the no CLS/INP guide. For turning one-off PageSpeed Insights into a schedule across many clients, start with Apogee Watcher or run a check on a public URL from the homepage tools.
References
CrUX methodology (Chrome for Developers)
Overview of CrUX (Chrome for Developers)
How to use the CrUX API (Chrome for Developers)
When PageSpeed Insights Shows No CLS or INP for Your URL (Apogee Watcher)
What Are Core Web Vitals? A Practical Guide for 2026 (Apogee Watcher)
When to Use Synthetic vs Real User Monitoring (Apogee Watcher)
PageSpeed Insights vs Automated Monitoring: When Manual Checks Aren't Enough (Apogee Watcher)
How to Schedule PageSpeed Monitoring: Test Frequency and Priority Across a Portfolio (Apogee Watcher)