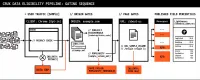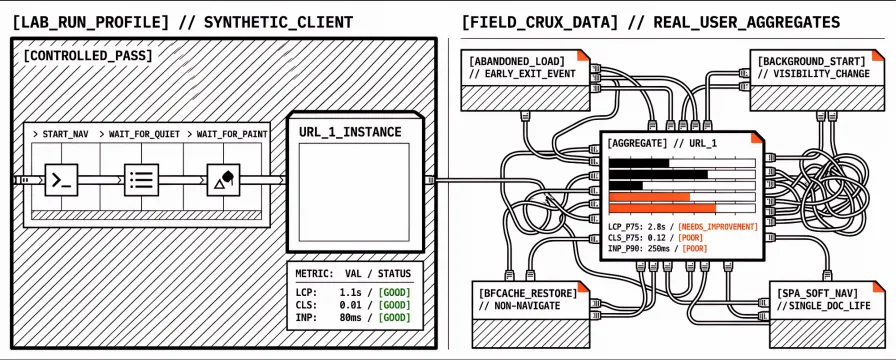
A Lighthouse or PageSpeed Insights laboratory run is designed to finish. The synthetic client navigates, waits for paints, and reports Largest Contentful Paint, Interaction to Next Paint, and Cumulative Layout Shift for that controlled pass. Chrome User Experience Report (CrUX) field percentiles are not the same experiment run later. They aggregate many real Chrome experiences, including visits that never complete a “full page load” story the way a lab profile does.
That gap is what people mean when they ask how CrUX handles partial page loads or partial sessions. Lab green and field amber on the same URL often coexist because the field bucket mixes completed navigations with abandoned tabs, background starts, back/forward cache restores, and (for many SPAs until soft-navigation metrics are available in reporting tools) long lives on a single document URL. What follows maps what field data includes and excludes, how that differs from Lighthouse, and what to put in a client report when the clocks disagree.
Keep When to Use Synthetic vs Real User Monitoring open for the broader lab-versus-field split, and When PageSpeed Insights Shows No CLS or INP for Your URL when metric rows are missing while other field data exists. Thresholds and “good” ranges sit in What Are Core Web Vitals? A Practical Guide for 2026.
What “partial page loads” means in CrUX field data
CrUX does not sell a public metric literally named “partial session.” In practice the phrase covers real experiences that diverge from a completed, foreground, full-document navigation of the kind Lighthouse scripts. Chrome’s CrUX methodology starts from eligible user experiences, then aggregates them into page-level and origin-level distributions. An “experience” is the metrics collected during a page view, not a synthetic end-to-end script that always waits for a quiet network.
Agencies usually meet four shapes of “partial” that get blurred in one client chat:
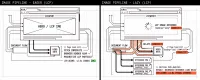
Abandoned or interrupted loads. The user navigates away, closes the tab, or loses connectivity before the lab-style quiet window, yet field may still record early paints or interactions that did fire.
Visibility and background starts. Pages opened in a background tab, or hidden before LCP settles, follow different LCP rules than a focused lab run.
Non-
navigaterestorations. Back/forward cache and prerender activations are real visits for users, but not every timer (especially Time to First Byte) is collected the same way as a cold document load.SPA soft navigations. Route changes that look like new pages to users may still be attributed to the initial document URL in classic CrUX Core Web Vitals until soft-navigation metrics are used.
Those shapes are why a retainer that only re-runs PageSpeed Insights after a deploy can look fixed in the lab while Search Console or the CrUX panel stays amber. The field distribution is answering a different question: what happened across many real visits, including ones that never matched the synthetic path. Lab colour and field colour are both honest answers; they are just answering different populations.
What CrUX includes that a Lighthouse run never sees
Field data is population data. Origin-level CrUX includes eligible experiences across the origin’s pages (subject to discoverability and popularity rules). Page-level CrUX needs enough samples for that URL. Neither side downsamples for convenience: Google has stated that aggregates use the eligible experiences that arrive, weighted by how often those experiences happen, not by how tidy they look in a waterfall.
Lighthouse does not visit the site as a busy shopper who opens five tabs, restores from history, or arrives via a soft navigation after checkout. It runs one (or a few) controlled profiles, which is a strength for regression testing: comparable conditions, repeatable budgets, dated history. It is a weakness if someone treats the lab pass as proof that field percentiles must move this week. PageSpeed Insights vs Automated Monitoring covers when scheduled lab history is still the accountable layer; partial-load mismatch is one reason field can lag or disagree even when lab looks clean.
CrUX also folds some complexity into the top-level page. Content in iframes is not reported as a separate CrUX URL; it can still move metrics on the parent page the user sees. Agencies debugging “our LCP is an embedded player” need that distinction labelled in the report, not buried in a screenshot caption.
What CrUX excludes (or stops measuring) mid-experience
Background and visibility. Not every browser event becomes a Core Web Vitals sample the way teams expect. Google tools that measure LCP do not treat a page loaded entirely in the background as a normal user-perceived load. The Largest Contentful Paint API can still emit entries in awkward visibility cases; the metric used for CrUX and related tooling ignores experiences where LCP is not a fair foreground story. A lab run that always starts focused will never reproduce that filter.
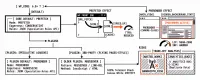
Interaction cut-off for LCP candidates. Once the user taps, scrolls, or presses a key, browsers stop treating later paints as new LCP candidates for analysis purposes. Real sessions often interact early, so the field stop can arrive sooner than in a synthetic run that sits idle until the largest element paints. That alone can separate a calm lab LCP from a noisier field distribution.
Timers that skip some navigation types. CrUX navigation types show how often visits are ordinary navigates, cached document loads, reloads, back/forward, bfcache restores, or prerenders. Core Web Vitals such as LCP are measured for bfcache restores in ways that match user perception of a new visit. Time to First Byte in CrUX is collected on full page loads, not on every restore path, so TTFB sample sizes and stories can diverge from LCP on the same origin. Treating every field metric as if it sampled the same set of navigations is a reporting error.
Eligibility gaps. Origins or URLs with no CrUX data yet are a different problem: not enough eligible samples or discoverability failures. That is covered in Why CrUX Has No Data for Your Site. Partial-load nuance only applies once field rows exist.
Lab vs field Core Web Vitals when loads are incomplete
Use an explicit comparison when a client asks why the lab card is green and the field card is not. The table below is the pairing we keep in decks so nobody treats PageSpeed Insights lab colour as a CrUX forecast. Each row answers one question clients usually ask in the same meeting.
| Question | Lab (Lighthouse / PageSpeed Insights lab) | Field (CrUX) |
|---|---|---|
| What is measured? | One controlled navigation under a fixed profile | Many real Chrome experiences over a rolling window |
| Does the run always “finish”? | Yes, by design | No; users abandon, hide tabs, or restore from cache |
| Device and network mix? | Emulated / fixed | Real devices and networks in the eligible sample |
| SPA route changes? | Usually one document load per run | Historically attributed to the initial URL; experimental soft-navigation metrics arriving in CrUX |
| Best use | Regression after deploy; budgets you can retest tomorrow | Ranking-facing experience; catch journeys lab never walked |
Lab versus field Core Web Vitals disagreements are often population disagreements, not “PageSpeed Insights is broken,” so say that plainly and then show which URLs you tested in the lab and which templates dominate traffic in analytics or Search Console groups. Aligning synthetic coverage with revenue and conversion paths does not force CrUX to match overnight. It does stop the team from optimising a quiet brochure URL while field pain sits on checkout.
When field categories move slowly after a fix, the rolling window and pipeline lag matter too. Why Your Core Web Vitals Fix Is Not in CrUX Yet covers the 28-day collection habit. Partial-load mix is an additional reason a single green lab screenshot is weak evidence for “field will be green by Friday.”
CrUX vs Lighthouse: same URL, different experience set
CrUX versus Lighthouse comparisons fail when people assume both tools sample the same visits. Lighthouse answers: under these conditions, what did this URL do? CrUX answers: among eligible Chrome users on this page or origin, what did the distribution of experiences look like?
Lighthouse will not invent a bfcache restore fraction, and CrUX will not pause the internet so every shopper waits for your hero image the way a lab profile does. Both can be correct. Client decks that print one Performance score next to one field category without labels invite false conclusions, so prefer two short labelled lines: lab result with date, strategy, and URL; field result with form factor and the collection window the tool shows.
Scheduled lab history still earns its keep, because partial sessions make field distributions harder to debug from a single paste. Agencies need a trail of comparable synthetic runs on the templates that matter. That is monitoring, not a substitute for CrUX.
Soft navigations and SPA routes: historical gap and October 2026 experiments
For years, SPA architectures complicated Core Web Vitals because soft navigations looked like new pages to users while platform APIs still treated the experience as one document life. CrUX methodology documents that limitation and points to How SPA architectures affect Core Web Vitals on web.dev. In that model, route transitions did not reset classic Core Web Vitals the way a full navigation would, so field scores could look harsh on long-lived documents or oddly attributed to landing URLs.
As of October 2026, Chrome has started publishing experimental CrUX metrics that include soft navigations, with an aim to graduate them later. Tooling catch-up will take time. Until your reporting stack shows those experimental series clearly, keep two habits: (1) do not pretend classic CrUX already splits every SPA route as its own page URL; (2) use first-party RUM or the newer soft-navigation APIs when you need route-level debugging ahead of CrUX tool support. Label experimental field rows as experimental in client language so nobody treats a preview series as Search Console fact.
What agencies should report when lab is green and field is amber
What we measured in the lab. Use a short script so the conversation stays honest across accounts. Dated Lighthouse or PageSpeed Insights lab runs on [list URLs], mobile and desktop as separate rows, under a fixed profile. Those runs completed by design, which is useful for regression and useless as a CrUX forecast on its own.
What field data is saying. CrUX (via PageSpeed Insights, Search Console, or the API) reflects a mix of real experiences, including visits that abandon early, change visibility, restore from bfcache, or stay on long SPA documents. Field amber does not mean the lab tool lied. It means the population of experiences is wider than one synthetic pass.
What we are not claiming. We are not saying the next lab refresh will force field percentiles this week. Collection windows and experience mix both move slowly relative to a deploy day. Partial loads are part of that mix rather than a bug in the PDF export.
What we will do next. Keep synthetic budgets on the journey URLs that match analytics and revenue, and re-check CrUX on a fixed schedule. If SPA routes dominate the product, add route-aware real-user monitoring or soft-navigation debugging rather than only re-running homepage Lighthouse. That script pairs with synthetic versus real-user roles in the monitoring guide linked earlier, and partial page loads are one more reason to layer clocks instead of picking a favourite colour on a single card.
FAQ
Do CrUX percentiles include users who leave before the page finishes loading?
Field data includes eligible experiences that occur in real browsing, not only visits that reach a lab-style quiet network. Early abandons can still contribute paints or interactions that fired. That is one reason distributions differ from a completed Lighthouse pass.
Why is lab LCP good when field LCP is poor?
Common causes include different devices and networks, background or visibility filters, interaction timing, navigation-type mix (including bfcache), SPA attribution, and URL selection that does not match traffic. Treat the disagreement as a population problem first. Then debug the templates that dominate real visits, not only the quiet URL that scored well in the lab.
Does bfcache count as a page load in CrUX?
Users experience bfcache restores as navigations. CrUX reports navigation-type fractions and measures Core Web Vitals for restores in defined ways. Some supporting timers such as TTFB are tied to full page loads, so do not assume every metric samples the same navigations.
Are SPA soft navigations in CrUX yet?
Historically, soft navigations were not separate classic Core Web Vitals page views in CrUX. Experimental soft-navigation metrics began appearing in CrUX around October 2026, but tooling catch-up varies. Confirm what your dashboard actually plots before you brief a client.
Should we stop lab testing and trust only CrUX?
No. Lab remains the regression and budget layer you can re-run on demand, while CrUX remains the public field distribution. Agencies need both labelled, plus journey-aligned URL lists.
CTA
When lab and field disagree, name the experience set: completed synthetic runs versus CrUX’s mix of partial, restored, and long-lived visits. Align scheduled lab checks with the URLs users actually travel, keep budgets on those templates, and re-read field categories on a fixed calendar rather than after every deploy. For eligibility gaps with no field rows at all, use the CrUX no-data guide. For turning one-off PageSpeed Insights into a schedule across clients, start with Apogee Watcher or run a public check from the homepage tools.
References
CrUX methodology (Chrome for Developers)
CrUX metrics (Chrome for Developers)
Navigation types now available in CrUX (Chrome for Developers)
Largest Contentful Paint (LCP) (web.dev)
Chrome UX Report discussions (Chromium; partial load sessions thread, May 2026)
When to Use Synthetic vs Real User Monitoring (Apogee Watcher)
When PageSpeed Insights Shows No CLS or INP for Your URL (Apogee Watcher)
PageSpeed Insights vs Automated Monitoring: When Manual Checks Aren't Enough (Apogee Watcher)
What Are Core Web Vitals? A Practical Guide for 2026 (Apogee Watcher)
Why CrUX Has No Data for Your Site (Apogee Watcher)
Why Your Core Web Vitals Fix Is Not in CrUX Yet (Apogee Watcher)