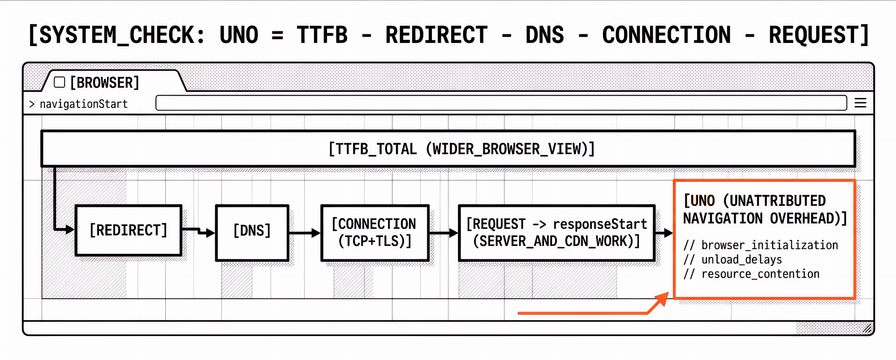
Time to First Byte is often treated as a synonym for back-end time. In the browser it is wider: everything from the start of the navigation until the first byte of the final response arrives. Redirects, DNS, connection setup, TLS inside that connection, network latency, CDN and origin work, and browser overhead can all sit inside the same number. When agencies paste a high Waiting (TTFB) bar into a client slide and write “server response,” they may be describing only the part the waterfall labels clearly.
Unattributed Navigation Overhead (UNO) is the residual after you subtract the phases Navigation Timing can name. Harry Roberts documented the metric and the agency reporting problem in UNO Is Underrated, building on Tim Vereecke’s framing: measure the whole journey to the first byte, subtract every attributed phase, and keep whatever is left. The leftover may be hard to pin on one owner. It is still time users paid for. Naming it stops missing milliseconds from being assigned to origin PHP by default.
What follows is a how-to for agencies who already walk delivery-layer TTFB in Network Performance for Web Teams: DNS, TLS, HTTP, CDN, and Cache Rules. When the attributed server phase is the real bottleneck after the residual is accounted for, hand off to TTFB Won't Go Down? Server-Side Culprits Beyond the Theme.
What unattributed navigation overhead (UNO) is
UNO is not a browser-provided metric. It is a calculated remainder:
UNO = TTFB − redirect − DNS − connection − (request → responseStart)
In Navigation Timing terms, TTFB for this purpose is responseStart − startTime (or the nearest equivalent your RUM tool exposes). Subtract the visible redirect span, DNS lookup, full connection span (TCP plus TLS when the API folds them together), and the span from requestStart to responseStart. What remains, floored at zero, is UNO.
That residual can include browser initialisation, delays while unloading the previous page, disk or cache access, resource contention, and timings hidden by cross-origin restrictions. It is not another name for redirect time. Hidden cross-origin redirects are a common source of UNO, but treating every unexplained millisecond as “a tracking redirect” repeats the same attribution mistake with a different label.
CrUX can tell you field TTFB is poor. It cannot decompose that time into phases, so it also cannot compute UNO. Without a Navigation Timing breakdown from real navigations (or a careful local reproduction), all of TTFB is effectively unattributed in the Google field dataset.
Navigation Timing TTFB breakdown: redirect, DNS, connection, request
A useful client-facing breakdown starts with the named hops, then shows the residual. Keep the language plain enough for a non-engineer stakeholder, and precise enough that engineers can map it back to DevTools. If the slide only shows total Waiting, every remedy conversation defaults to hosting.
| Phase | What it usually covers | Where teams over-blame |
|---|---|---|
| Redirect | Visible same-origin (or opted-in) redirects before the final response | Ignoring hidden cross-origin hops that never appear in `redirectCount` |
| DNS | Domain lookup for the final host | Blaming “DNS” when connection or residual dominates |
| Connection | TCP + TLS setup for the final host | Calling all Waiting “TLS” when connect is short |
| Request → first byte | Time from sending the request until `responseStart` | Calling this alone “the server” when UNO is large |
| UNO | Everything in TTFB not in the rows above | Leaving it unnamed so it inherits the server label |
Lighthouse and PageSpeed Insights still surface high first-byte time under diagnostics such as Reduce initial server response time. That audit name is historically server-shaped. It does not prove that PHP, WordPress cron, or database load owns the whole bar. Pair the lab label with a Navigation Timing breakdown before you write the remediation paragraph. PageSpeed Insights versus automated monitoring explains why a single paste also misses hour-of-day and campaign-mix effects that change which phases dominate.
For DNS, TLS, HTTP version, and CDN cache rules that actually move the attributed network phases, stay inside the network performance guide. The focus here is the slice those guides do not name: the unattributed remainder.
Why redirect, DNS, and connection phases still leave a gap
Navigation Timing often fails to add back up to TTFB. Gaps exist between timestamps. Some timings are deliberately hidden. The browser still includes that time in TTFB; it simply will not (or cannot) attribute it in the redirect, DNS, or connection fields.
Cross-origin redirects are the clearest example. When a navigation includes a cross-origin hop, Navigation Timing has traditionally reported redirectStart, redirectEnd, and redirectCount as zero. Overall TTFB still includes the hop. The redirect vanishes from the breakdown and lands in UNO. Common journeys include affiliate or ad tracking wrappers, URL shorteners, social outbound wrappers, and even http:// to https:// on the same hostname. A change of scheme is a change of origin. What looks like a harmless first-party canonicalisation can still hide redirect timing.
Synthetic tests that open the final landing URL never walk that chain. CrUX folds the cost into TTFB. Agencies comparing a clean lab homepage to a paid-search landing path then argue past each other: one chart shows a short Waiting bar, the other shows field TTFB that “must be the server.” Segment by landing page, campaign, and referrer when UNO rises. Reproduce representative journeys in DevTools instead of assuming origin compute.
Chrome has started improving opt-in visibility for some cross-origin redirect timing via Timing-Allow-Origin on redirecting servers. Adoption across shorteners and campaign platforms will be uneven for a long time. Even with better visibility, UNO still matters: not every residual is a redirect, and not every redirect will opt in.
How to calculate UNO from Navigation Timing
On a page you control, open DevTools Console after a hard navigation and read the navigation entry. The shape matches Harry’s public snippet:
const navigation = performance.getEntriesByType('navigation')[0];
const span = (end, start) => Math.max(0, end - start);

const uno = Math.max(0, Math.round(
  (navigation.responseStart - navigation.startTime) -
  span(navigation.redirectEnd, navigation.redirectStart) -
  span(navigation.domainLookupEnd, navigation.domainLookupStart) -
  span(navigation.connectEnd, navigation.connectStart) -
  span(navigation.responseStart, navigation.requestStart)
));
Do not treat a single Console value as portfolio truth. Cache warmth, device, connection, and previous-page unload all move the residual. For client work, collect UNO as both a duration and an occurrence count in RUM (or in a small beacon you control), then segment. Chart it beside redirect, DNS, connection, attributed server waiting, total TTFB, and Largest Contentful Paint. When LCP is TTFB-sensitive, unexplained first-byte time is not academic; it delays paint. A Quick Way to Fix LCP: Four Changes That Cut Time to Paint still applies after you know whether the early wait is attributed server time or UNO.
For a quick sanity check of hidden redirects, open a shortened URL that lands on a known host, then compare redirectCount (often zero) with a non-zero UNO. Contrast that with a same-origin trailing-slash redirect that does enumerate. The point is not the demo URL; it is that visible redirect count alone is a poor map of real campaign traffic.
What agencies should name in client reports when TTFB looks “server-only”
Client reports need a labelled residual. A practical slide or appendix row looks like this:
Total TTFB (lab on the money URL, plus field TTFB when CrUX exists).
Attributed phases you can defend: redirect (visible), DNS, connection, request→first byte.
UNO as “unexplained navigation time inside TTFB,” with a one-line definition.
Next action by owner: campaign/redirect chain, delivery (DNS/TLS/CDN), or origin application.
Write the sentence that prevents the wrong ticket. Prefer: “Field TTFB is elevated; Navigation Timing leaves X ms unattributed after redirect, DNS, connection, and request timing. We will reproduce campaign landings before we open a hosting upsizing ticket.” Avoid: “Server response is slow” when the only evidence is a total TTFB bar.
Use Performance Budget Thresholds Template so money URLs have explicit first-byte budgets, then annotate whether breaches are attributed server time or UNO-heavy. Schedule lab coverage on priority URLs with PageSpeed monitoring test frequency and priority across a portfolio so you are not inventing the breakdown from a single Friday afternoon paste. Watcher’s multi-tenant schedules keep those lab baselines comparable week to week; they do not replace RUM for UNO segmentation, and you should say that plainly when the residual only appears on campaign landings.
When the attributed server phase is the real bottleneck
Name UNO first. Then look at the request→responseStart span (and any RUM “server” or Waiting attribution your tool exposes after known network phases). If that attributed slice dominates, and DNS/connect/UNO are small, origin work is the honest story.
That is when TTFB Won't Go Down? Server-Side Culprits Beyond the Theme becomes the runbook: WP-Cron storms, cold PHP workers, missing object cache, database load, backup plugins at peak. Do not start there when UNO or hidden redirect chains explain most of the bar. Do not skip there when the residual is already named and still tiny beside a long attributed wait.
| Pattern | Likely owner | First move |
|---|---|---|
| High UNO on campaign/referrer segments; lab direct URL fine | Redirect / landing path | Reproduce chain; talk to tracking/shortener owners |
| High DNS or connect; UNO modest | Delivery / network | [Network performance checklist](https://apogeewatcher.com/blog/network-performance-dns-tls-http-cdn-cache-rules) |
| High request→first byte; UNO and connect small | Origin application | [Server-side TTFB checklist](https://apogeewatcher.com/blog/ttfb-wont-go-down-server-side-culprits-beyond-theme) |
| Everything elevated after a browser-major mix shift | Population / measurement | Annotate releases; do not only ship origin tickets |
TTFB is not a Core Web Vital, but it still gates LCP because HTML must arrive before the largest content can paint. Keep that link explicit in reports so stakeholders do not treat first-byte work as vanity once LCP is the slide title. Naming UNO does not replace LCP fixes; it stops you spending the LCP budget on the wrong first-byte owner.
Why CrUX and one-off lab runs miss the unattributed slice
CrUX reports field TTFB without the Navigation Timing phases needed for UNO. Useful as a population signal; useless as a phase budget. One-off PageSpeed Insights or Lighthouse runs on the final URL skip affiliate and shortener chains, warm different caches, and label the wait with server-shaped language. Neither artefact is wrong for what it measures. Both are incomplete if your clients’ money arrives through wrapped links.
Proper RUM (commercial, open-source, or homegrown) that retains navigation timestamps, page-view context, and dimensions is how UNO becomes actionable. You need duration and occurrence count, not only a p75. You need breakdowns by landing page, campaign, referrer, browser, device, and connection. Synthetic schedules still matter for regression detection on known URLs; they answer a different question. When to use synthetic versus real user monitoring is the pairing guide when a stakeholder asks which chart to trust.
FAQ
What is unattributed navigation overhead?
It is the part of Time to First Byte left after subtracting the redirect, DNS, connection, and request-to-response phases exposed by Navigation Timing. It is a residual metric, not a single browser-reported timer. You calculate it so unexplained time has a label instead of inheriting the server narrative.
Is UNO the same as redirect time?
No. Hidden cross-origin redirects often inflate UNO, but browser work, cache access, unload delays, and other gaps can sit there too. Do not rewrite “unattributed” as “redirects we have not counted yet” without evidence from reproduction and referrer or campaign data.
Why are some redirects missing from Navigation Timing?
For privacy and origin-boundary reasons, cross-origin navigation redirects have traditionally reported zero redirect timing and count even when TTFB includes them. Scheme changes such as HTTP to HTTPS count as cross-origin even on the same hostname. The hop still costs users; only the breakdown loses it.
Can CrUX report UNO?
No. CrUX exposes field TTFB without the phase timestamps required to calculate the residual. Use RUM or a Navigation Timing beacon on your own traffic if you need the split.
How should we talk about this in a client report?
Show total TTFB, the named phases, and a labelled UNO row. State the next owner (campaign path, delivery, or origin) instead of defaulting every elevated first-byte chart to “upgrade hosting.” One honest residual row prevents a week of origin tickets that never touch the real journey.
When do we optimise the server instead?
When the attributed request→first-byte (or tool-equivalent server) phase dominates after UNO and network phases are small. Use the server-side TTFB checklist. That hand-off is intentional: UNO naming first, origin work second.
If your retainers still describe every Waiting bar as server time, add UNO to the next report cycle on two or three campaign-heavy URLs and compare it with a direct lab navigation. Keep scheduled lab baselines on those URLs while you wire RUM (or a small beacon) for the Navigation Timing breakdown clients never see in CrUX alone. Start a free Apogee Watcher trial when you want those lab checks on a multi-tenant schedule without pasting PageSpeed Insights by hand.
References
Unattributed Navigation Overhead (UNO) Is Underrated (Harry Roberts / CSS Wizardry; metric coined by Tim Vereecke)
Web-Perf Wednesday 006 – Faster Browser Releases Change Your RUM Population (CSS Wizardry)
Time to First Byte (TTFB) (web.dev)
Network Performance for Web Teams: DNS, TLS, HTTP, CDN, and Cache Rules
PageSpeed monitoring: schedule test frequency and priority across a portfolio