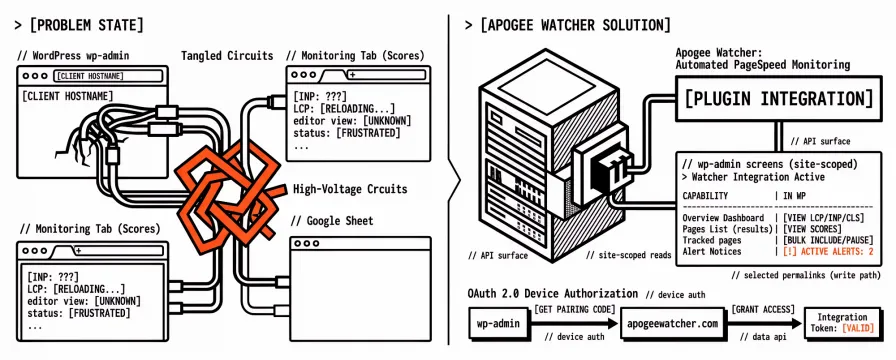
Delivery teams already know the bounce: client hostname open in WordPress, scores somewhere else in a monitoring tab, and nobody sure the editor who just published saw the same numbers. Search for a “WordPress speed plugin” and you still get optimisers first. We wanted the other job inside wp-admin: continuous monitoring evidence on top of whatever cache or image plugin you already trust.
Apogee Watcher: Automated PageSpeed Monitoring is that client. You pair one WordPress install to one Watcher site, read lab scores and open alerts where editors already work, and from Connection mark which published pages should sit on Watcher’s scheduled list. Watcher still owns schedules, PageSpeed Insights quota, budgets, and history. The plugin does not paste a Google API key into WordPress, and it does not rewrite your theme.
Behind that sits the customer API the plugin talks to: device authorisation, site-scoped reads, and the first write path for selected permalinks. You do not need a release calendar to use it. If you want the wider WordPress monitoring playbook (budgets, alerts, multi-page coverage), keep WordPress Performance Monitoring: The Complete Guide open beside the install. For lab context on WordPress portfolios, see Core Web Vitals benchmarks for WordPress sites (2026 data). What follows is what is live now: API surface, install and updates, pairing, wp-admin screens, and what we still leave on the roadmap.
What shipped: WordPress plugin and customer API
The official WordPress client needs a site-scoped API, so we shipped that first: OAuth 2.0 device authorisation, a pairing screen on Watcher, and reads for integration identity, site overview, pages, and alerts. Apogee Watcher: Automated PageSpeed Monitoring talks only to https://apogeewatcher.com. There is no custom API base URL for operators to misconfigure.
On top of those reads we added the write path agencies asked for next: bulk upsert of selected public permalinks so WordPress can mark pages as scheduled for tests, or pause them, without deleting rows Watcher already holds. That batch path powers Tracked pages on the Connection screen. Enqueueing a fresh lab run from wp-admin (“Run test”) is still out; schedules and manual runs remain Watcher product actions until that endpoint ships.
WordPress integration is available on Free and every paid plan. You do not need the broader Agency API access package just to connect WordPress. Free stays limited by site cap and the same test quota anniversary window as the rest of the product, so connecting never becomes a parallel free PageSpeed Insights farm inside WordPress.
| Capability | What you get in WordPress |
|---|---|
| Device pairing | Start connect, finish grant, disconnect and revoke |
| Integration identity | Confirm which Watcher site is bound |
| Site overview | Dashboard widget (latest score + LCP / INP / CLS) |
| Pages and results | Watcher → Test results (pages + latest alerts) |
| Alerts | Notices when Watcher reports open alerts |
| Tracked pages | Bulk include or pause scheduled pages for the bound site |
| Plugin updates | Dashboard updates from Watcher without WordPress.org |
Tokens are site-scoped. Approving a connection binds one WordPress install to one Watcher site under an organisation you already manage, or create during pairing. That matches how agencies already group clients in Watcher rather than inventing a second tree inside WordPress. Step-by-step pairing copy also lives in Connect the WordPress plugin.
WordPress speed plugin vs monitoring-first Apogee Watcher
Type “WordPress speed plugin” or “WordPress performance plugin” into Google and you land on cache, minify, critical CSS, and CDN products. Those tools change how the site serves HTML and assets. They are the right answer when the brief is “make this theme faster.” They are the wrong answer when the brief is “tell me when Lighthouse or budgets moved after last week’s deploy.”
Apogee Watcher’s plugin is monitoring-first. It does not cache pages, defer scripts, convert images, or strip CSS. It shows results Watcher already collected with scheduled or manual PageSpeed Insights runs, and it can adjust which pages sit on that schedule. Keep Jetpack Boost, LiteSpeed Cache, WP Rocket, or your host’s page cache for optimisation. Keep Watcher for evidence, history, and alerts across the portfolio.
| Job | Typical WordPress speed / performance plugin | Apogee Watcher: Automated PageSpeed Monitoring |
|---|---|---|
| Change how the site loads | Yes (cache, minify, CDN, lazy-load) | No |
| Show Lighthouse / lab CWV in wp-admin | Sometimes (often with a Google key in WP) | Yes (reads Watcher) |
| Hold Google PageSpeed Insights credentials | Often in the plugin settings | Never; Watcher holds quota |
| Select which URLs Watcher schedules | Rarely | Yes (Tracked pages → Watcher page list) |
| Multi-site agency history, budgets, org reports | Rarely | On Watcher (SaaS), surfaced in WP for the bound site |
| RUM from every visitor | Some Core Web Vitals plugins | Not this plugin; Watcher remains lab-first, with Chrome UX Report field data when PageSpeed Insights returns it |
For a longer comparison of RUM-heavy WordPress tooling versus agency portfolio monitoring, see PageVitals vs Apogee Watcher. The short version for this release: if you install our plugin hoping it will raise mobile Performance by twenty points on its own, uninstall it and pick an optimiser. If you install it so editors and delivery leads share the same latest scores without exporting another CSV, you are in the right place.
How to install and update the WordPress plugin
Requirements are ordinary: WordPress 5.8+, PHP 7.4+, and outbound HTTPS to apogeewatcher.com. Prefer the packaged ZIP on Tools → WordPress (same page as the product pitch). GitHub remains the source tree if you prefer cloning into wp-content/plugins/apogee-watcher. A WordPress.org directory listing is pending.
Self-hosted updates are live for current ZIP installs. The plugin declares an Update URI pointed at our tools page; WordPress then asks Watcher’s public latest endpoint and can download the matching package through the normal Dashboard → Updates flow. Icons on the Plugins and Updates screens come from the same latest payload, so the row reads as Apogee Watcher rather than a blank placeholder. If an older install never received that Update URI, install once from the tools page, then leave Updates to Watcher afterwards.
Translations for Greek, French, and German ship in the plugin language files. English remains the default strings in the PHP; locales load when WordPress is set to those languages. Agencies that keep client admin in a local language get Connection and Results labels without waiting on a directory listing for language packs.
How device pairing connects WordPress to Watcher
After activate:
Open Watcher → Connection and choose Connect to Watcher.
The plugin starts device authorisation and shows a user code. Watcher opens (or you sign in / create a Free account). Pairing can suggest the WordPress admin email as the signup address.
On Watcher, approve the device, pick the organisation, and bind a matching site (or create a site when your plan still has capacity).
Return to WordPress. The plugin finishes pairing and stores site-scoped tokens in WordPress options.
Open the dashboard widget or Watcher → Test results. Use Open Watcher when you need the full site screen in the app.
Disconnect revokes the refresh token. The plugin does not phone home for monitoring before an administrator clicks Connect. Update checks against Watcher’s latest endpoint are separate from pairing: they exist so non-directory installs can stay current, and they do not replace the connect grant.
What you see in wp-admin after connect
Once paired, four surfaces matter for day-to-day work.
Dashboard widget. Latest Performance-oriented score context plus LCP, INP, and CLS from the Watcher overview payload. It is a glance for the bound site, not a replacement for the multi-page domain report or organisation weekly PDF, and it will not invent pages Watcher has never tested.
Watcher → Test results. A two-column layout: pages Watcher already monitors for that site on the left, and the latest open or recent alerts on the right. Titles link through to the Watcher page where useful, timestamps open the stored result, and mobile/desktop scores sit side by side. Page names and URLs come from Watcher’s page list, not from a fresh sitemap crawl inside WordPress, so what you see matches the SaaS site tree you already maintain.
Alert notices. When Watcher has open alerts for the bound site, WordPress shows an admin notice so a content editor who never opens the Watcher app still sees that something needs attention. Closing or tuning those alerts still happens in Watcher, where budgets and cooldown rules live.
Tracked pages (Connection). After connect, Connection lists published WordPress pages beside whether Watcher already schedules them. Bulk include upserts selected permalinks onto the Watcher site (stable CMS ids so title or slug changes do not orphan the row). Bulk pause marks those Watcher pages inactive for scheduled tests; it does not delete history or remove the page record. That is deliberate: agencies often pause a URL for a campaign window without throwing away the timeseries. Off-host URLs are rejected; the batch never mass-deletes pages missing from the WordPress selection.
None of these screens enqueue a new PageSpeed Insights run by themselves. If scores look stale, check the site schedule and remaining tests in Watcher first. Manual runs remain product actions on the SaaS side until a dedicated test-jobs path ships.
Why quota and schedules stay in Watcher
Several WordPress plugins call Google’s PageSpeed Insights API with a key stored in wp-admin, or with a shared proxy that still burns someone else’s quota. That pattern fails agencies for predictable reasons. Keys leak across client installs, Free Google quotas collide, and nobody can answer “how many lab runs did this organisation use this anniversary period?” from one place.
Watcher already tracks test consumption, anniversary windows, and per-site usage in the app. The WordPress plugin is a thin client of that system: reads for scores and alerts, and a narrow write for which pages are active on the schedule. Scheduling frequency and mobile versus desktop strategy stay on the Watcher site record. A later product spotlight will cover API fairness maths across a portfolio; this note only draws the boundary. For why manual PageSpeed Insights tabs do not scale either, see PageSpeed Insights vs automated monitoring.
If a Free plan is already on one site, pairing a second WordPress install that would create another site hits the plan’s site cap during approval. The pairing screen hides Approve when Free capacity blocks create. That is intentional: the plugin must not become a back door around plan limits.
Who can use it today
Any organisation on Free or a paid plan that includes WordPress integration can complete device pairing for an eligible site. Agency workspaces bind client WordPress installs to the matching Watcher site the same way they already organise portfolios. Freelancers on Free get one site of monitoring with the plugin as a convenience layer in wp-admin. In-house teams on a single WordPress property get the same connect flow without buying Agency solely for the plugin.
Multi-tenant rules do not change because WordPress is involved. Tokens cannot read another site’s overview. Organisation roles (Admin, Manager, Viewer) still govern who may approve pairing and who may change schedules in the app. The plugin surfaces data and selected page writes; it does not invent a second permission model inside WordPress beyond the usual capability checks on its own screens.
What is still open
What is live today matches the plugin README: connect, dashboard widget, test results and alerts, Tracked pages include/pause, translations, and self-hosted updates from Watcher. Two gaps remain for client scopes.
WordPress.org listing is pending. For now, you can download from Tools → WordPress or GitHub. Self-hosted updates already cover dashboard upgrades without the directory.
Run test from wp-admin is in development. Pairing and Tracked pages do not enqueue a fresh PageSpeed Insights run; schedules and manual tests stay in Watcher until that path exists.
Theme or plugin update annotations on a Watcher timeline are something we are working on for future releases. Tracked pages already upserts selected public permalinks; we are not building a “dump the whole sitemap” sync from WordPress.
We will announce a directory listing and Run test when they are real. Until then, treat the plugin as useful in wp-admin for scores, alerts, and schedule selection, not as a full Watcher replacement.
FAQ
Is Apogee Watcher: Automated PageSpeed Monitoring a speed optimisation plugin?
No. It does not cache, minify, or rewrite assets. It shows monitoring results from Apogee Watcher and can adjust which pages are scheduled. Use a dedicated WordPress performance plugin when you need optimisation; use this plugin when you need scores, alerts, and schedule selection in wp-admin.
Do I need a Google PageSpeed Insights API key in WordPress?
No. Watcher holds the Google relationship and quota. The plugin uses site-scoped Watcher tokens after device pairing.
Do I need an Agency plan?
No for WordPress connect, reads, and Tracked pages. Free and paid plans that include WordPress integration can pair. Agency API access is a broader programmatic package and is not required for the official WordPress client.
Where do I download it?
From Tools → WordPress (recommended ZIP) or the public repository Apogee-Information-Systems/apogee-wp-watcher. WordPress.org is not listed yet. Current installs receive updates through the WordPress Updates screen via Watcher’s self-hosted update API.
Will connecting run tests automatically?
Pairing alone does not enqueue lab runs. Schedules and manual tests remain in Watcher. The plugin reads stored overview, pages, and alerts; Tracked pages only changes which URLs are active on the existing schedule.
Can one plugin install monitor my whole agency portfolio?
One WordPress install pairs to one Watcher site. Portfolio dashboards, organisation reports, and cross-client alerts stay in Watcher. Install the plugin on each client CMS when that site’s editors need the widget locally.
What does Tracked pages pause do?
It marks the matching Watcher page inactive for scheduled tests. It does not delete the page or wipe history. Include again when you want that URL back on the schedule.
Get the plugin into wp-admin this week
If you already monitor WordPress clients in Watcher, download Apogee Watcher: Automated PageSpeed Monitoring, open Watcher → Connection, and complete device pairing so the people who live in wp-admin see the same latest scores and open alerts without another browser profile. Use Tracked pages to include the URLs that matter for that client, then leave cadence and quota on Watcher. If you do not have an account yet, pairing can create a Free workspace and bind the first site within plan limits.
The bounce between CMS and monitoring tab is the failure mode this release addresses. Put the scores where the editors already are, then open Watcher when you need the full portfolio story.
Create or open your workspace at Apogee Watcher, then connect the plugin on the WordPress site you care about first.
References
Apogee Watcher for WordPress (GitHub) (official plugin repository)
Tools → WordPress (ZIP download and product page)
Connect the WordPress plugin (Apogee Watcher docs)
WordPress Performance Monitoring: The Complete Guide (Apogee Watcher)
Core Web Vitals benchmarks for WordPress sites (2026 data) (Apogee Watcher)
PageVitals vs Apogee Watcher (Apogee Watcher)
PageSpeed Insights vs automated monitoring (Apogee Watcher)