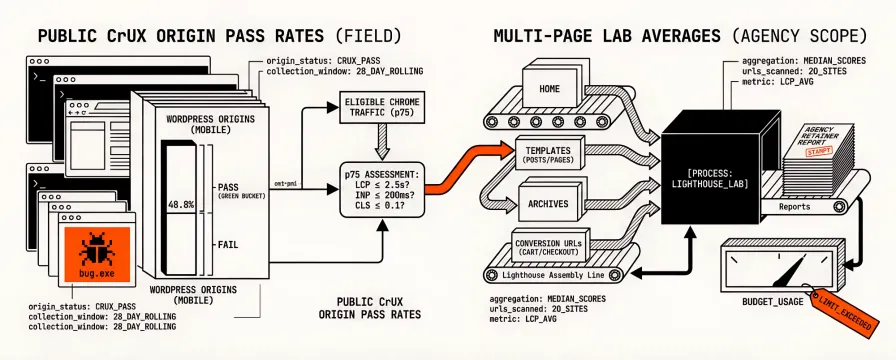
Public Core Web Vitals numbers for WordPress usually arrive as origin pass rates: roughly half of WordPress origins clear all three vitals on mobile in large CrUX-based studies, and vendor how-tos still start from a single homepage PageSpeed Insights run. An agency with twenty WordPress retainers needs a different baseline. What do multi-page lab averages look like once home, templates, and conversion URLs sit in the same domain report?
Neither number replaces the other. Field pass rates describe eligible Chrome traffic at the origin; multi-page Lighthouse averages describe the templates you still have to budget and schedule. What follows publishes a reproducible Watcher sample from client-tagged WordPress sites, sets it beside public CrUX orientation, and points at the work that usually moves the needle first. The method matches our Shopify, Magento, and fashion benchmark posts. For WordPress monitoring practice after the numbers, see WordPress Performance Monitoring: The Complete Guide.
What counts as a reliable WordPress Core Web Vitals benchmark in 2026
For Core Web Vitals, the strongest public field source remains the Chrome UX Report (CrUX). Google’s methodology is clear about inclusion: pages and origins must be publicly discoverable and popular enough, data comes from eligible Chrome users, and thresholds are read at the 75th percentile over a rolling window. That is why Search Console and the field section of PageSpeed Insights matter for ranking and real-user claims, while a single Lighthouse run remains a diagnostic tool.
Google’s published thresholds are unchanged for the three metrics:
| Metric | Good (p75) | Needs improvement | Poor |
|---|---|---|---|
| LCP | ≤ 2.5 s | 2.5 s – 4.0 s |
|
| INP | ≤ 200 ms | 200 ms – 500 ms |
|
| CLS | ≤ 0.1 | 0.1 – 0.25 |
|
An origin or URL group passes Core Web Vitals when all three sit in the good bucket at p75. A Lighthouse Performance score is a different artefact: it blends lab timings under a throttled environment and is useful for regression detection, not as a substitute for CrUX pass/fail. If you need a refresher on the three metrics themselves, start with What Are Core Web Vitals? A Practical Guide for 2026.
A useful WordPress benchmark therefore states four things up front: which clock (CrUX field versus Lighthouse lab), which URLs (homepage only versus archives, posts, and conversion paths), how scores are aggregated (single URL versus median or mean across pages), and the collection window. Plugin marketing and hosting dashboards often quote one green score without that scaffolding. Agencies managing a mixed WordPress book need the scaffolding more than another screenshot.
Sources:
Public CrUX context for WordPress in 2026
Independent researchers combine HTTP Archive technology detection with Chrome UX Report data and publish WordPress pass rates that orient a portfolio conversation. HostingStep’s June 2026 rebuild from the HTTP Archive CrUX crawl reports about 48.8% of WordPress mobile origins and 53.3% of desktop origins passing all Core Web Vitals in that sample (millions of origins). PageSpeed Matters’ CMS study places WordPress near the bottom of major general-purpose CMS mobile pass rates in its cut (about 38.4% all-three on mobile among measured WordPress sites). The spread is expected when samples, devices, and “complete metrics” filters differ.
What those studies agree on matters more than the exact percentage. WordPress INP and CLS pass rates are often healthier than LCP. Loading, and especially server response and Largest Contentful Paint, is where origins fail. That field pattern matches what agencies feel when a client’s Search Console “needs improvement” is almost always an LCP story, not an interactivity lecture.
Treat public CrUX tables as orientation for the platform, then measure the URL set you actually retain. A homepage that passes origin-level CrUX can still hide slow templates that never earn enough traffic to appear at URL level. Multi-page lab averages are how you catch that before the retainer review.
Sources:
Core Web Vitals Statistics 2026 (WordPress) (HostingStep / HTTP Archive)
CMS Core Web Vitals 2026 (PageSpeed Matters)
Multi-page lab sample from Watcher WordPress clients
We keep WordPress-tagged client sites in Watcher and run multi-page PageSpeed Insights analyses that store Lighthouse lab metrics per selected URL. For this snapshot we took the latest domain report for every site with platform_cms=WordPress, and an aggregated report payload (n = 381 sites). Reports were generated between 27 August and 2 November 2026.
Each report averages Lighthouse metrics across the URLs selected for that domain (median 21 analysed pages per site; 7,278 page runs in total). Values below are store-level averages of lab runs, not single-URL CrUX p75s. A site that looks healthy on one landing page can still drag the average when archives, templates, and form pages are included, which is the usual WordPress pattern once page builders, shared headers, and plugin scripts repeat across templates.
Mobile and desktop Lighthouse Performance
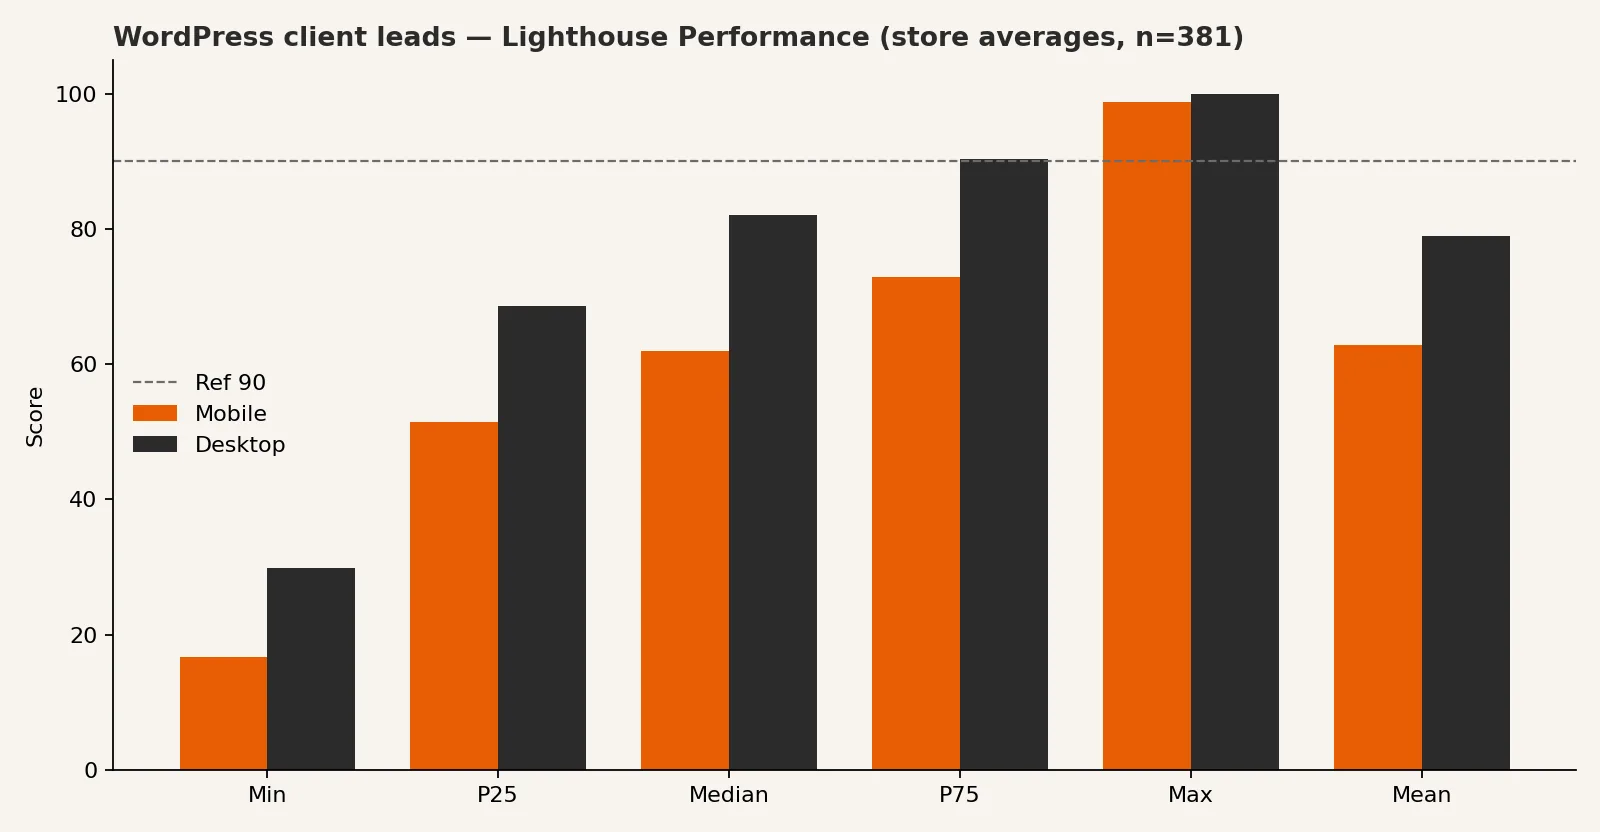
| Slice | Mobile Performance (avg) | Desktop Performance (avg) |
|---|---|---|
| Minimum | 17 | 30 |
| 25th percentile | 51 | 69 |
| Median | 62 | 82 |
| 75th percentile | 73 | 90 |
| Maximum | 99 | 100 |
| Mean | 63 | 79 |
Half of the sample sits at or below a mobile Performance average of 62. 296 / 381 sites clear a mobile average of 50, 117 / 381 clear 70, and 23 / 381 reach a mobile store average of 90. Desktop is kinder in the same runs (median 82), which matches what agencies see when a client forwards a desktop-only screenshot and assumes the WordPress site is fine. Compared with our Shopify Watcher sample (median mobile Performance about 51 on 64 stores) and Magento verified sample (median about 58 on 76 stores), this WordPress client set sits a little higher on the Performance dial. The shared pattern still matters more than the gap: multi-page lab averages remain a remediation queue, not proof that monitoring can stop.
Mobile lab Core Web Vitals timings (store averages)
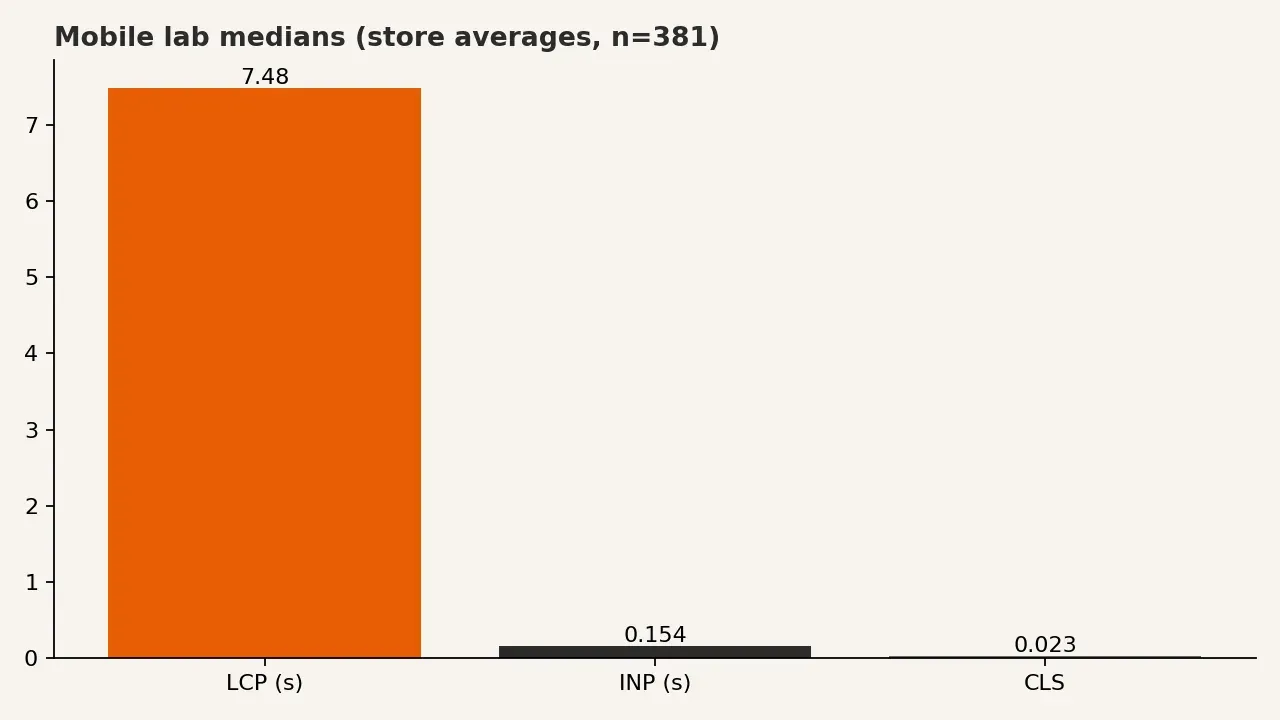
| Metric | Median | 75th percentile | Notes in this sample |
|---|---|---|---|
| LCP (s) | 7.48 | 10.5 | 18 / 381 store averages ≤ 2.5 s |
| INP (s) | 0.154 | 0.229 | 251 / 381 store averages ≤ 0.20 s |
| CLS | 0.023 | 0.066 | 328 / 381 store averages ≤ 0.1 |
CLS is the bright spot. INP at the median clears the “good” lab line for most of the cohort, though the upper quartile still needs work. LCP is the structural problem: fewer than one in twenty sites averages ≤ 2.5 s across the selected pages under lab throttling. That lines up with public CrUX stories that blame loading more than interactivity on WordPress origins, and with the retainer reality that hero images, render-blocking CSS, and plugin JavaScript dominate the first paint path.
Recurring mobile Lighthouse opportunities
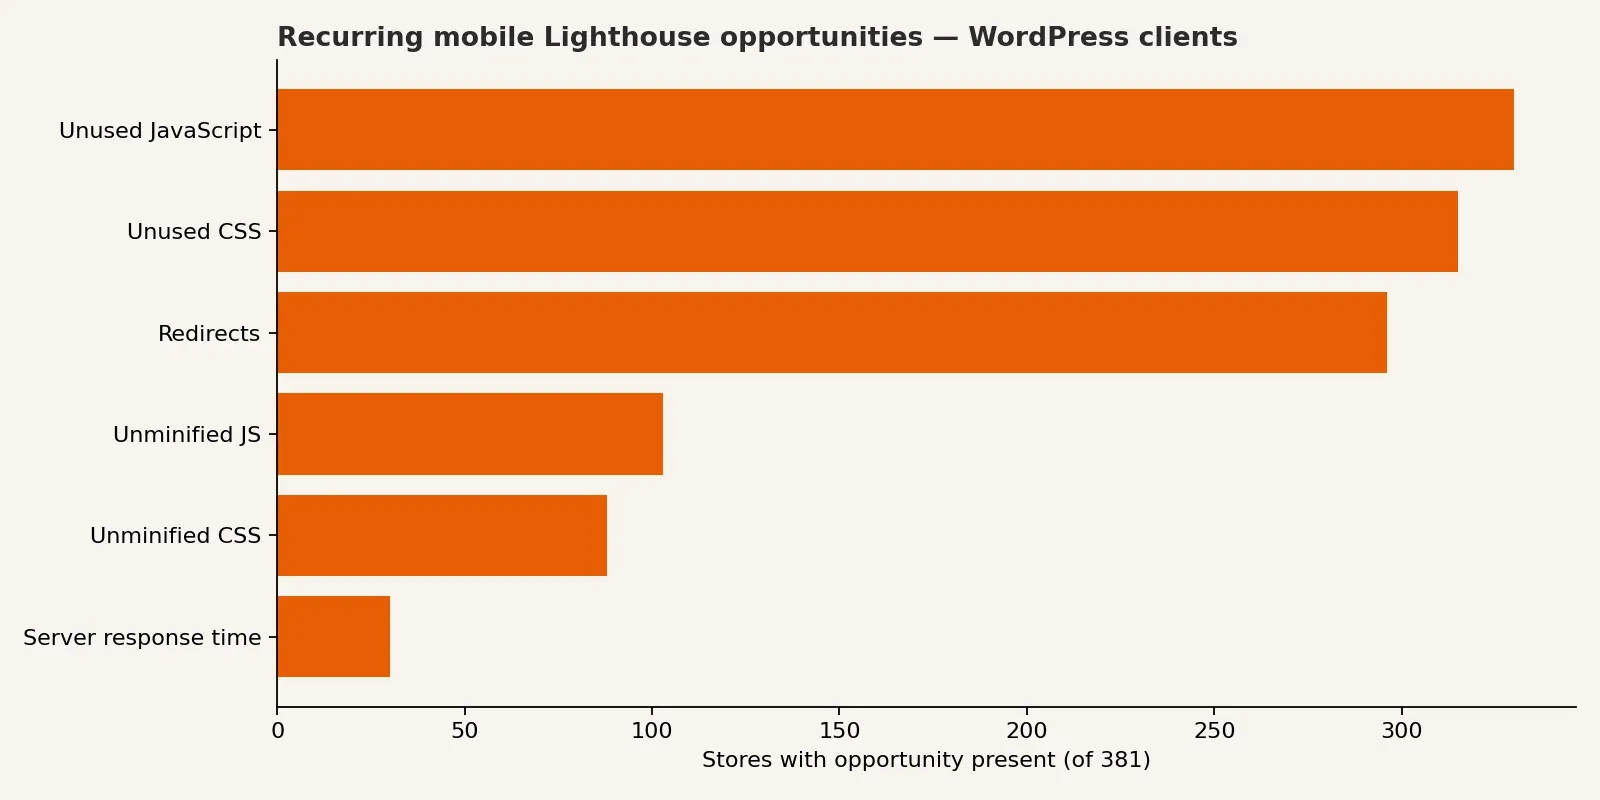
| Opportunity | Sites (of 381) |
|---|---|
| Reduce unused JavaScript | 330 |
| Reduce unused CSS | 315 |
| Avoid multiple page redirects | 296 |
| Minify JavaScript | 103 |
| Minify CSS | 88 |
| Initial server response time | 30 |
Unused JavaScript and unused CSS appear on most of the book. Redirect chains are almost as common. Server response shows up less often as a named opportunity in this lab cut, which does not mean TTFB is fine in the field; it means the Lighthouse opportunities list is dominated by front-end weight once the document arrives. For the hosting-versus-theme argument agencies still have with clients, see WordPress Site Slow? It Is Not Always the Hosting. For speculation and prerender plugins that can help navigation and sometimes hurt LCP, see WordPress Speculation Rules and Prerender vs Core Web Vitals.
How to use these WordPress benchmarks on a retainer
A useful next step is to open one client domain report and compare its mobile Performance average and lab LCP to the medians above. Sites well above a mobile Performance of 62 with lab LCP near the good line are not the priority queue; sites below the median with unused JavaScript and redirects repeating across templates usually are. That single comparison is enough to decide whether the next sprint is LCP work or quiet monitoring.
Budgets stay clearer when they name the artefact: lab LCP and Performance on a fixed URL set, reviewed on a schedule, with field CrUX added when the origin has data. The Complete Guide to Performance Budgets for Web Teams covers threshold design, and PageSpeed Monitoring: How to Schedule Test Frequency and Priority Across Your Portfolio covers cadence across many WordPress clients. Homepage-only PageSpeed Insights understates template drag, so the cost of inaction is another quarter of retainers argued from screenshots instead of a shared baseline.
FAQ
Do these lab averages mean most WordPress sites fail Core Web Vitals in Search?
No. Lab store averages and CrUX origin pass rates are different clocks. Public CrUX studies still show a large share of WordPress origins passing all three vitals. The Watcher sample shows how multi-page lab averages look on client WordPress stacks under throttling.
Why is median lab LCP so far from 2.5 s?
Domain reports average many templates. Heroes, page-builder CSS, and plugin scripts that repeat on archives and conversion URLs pull the store average up even when one marketing URL looks acceptable.
Is WordPress worse than Shopify or Magento in Watcher’s samples?
On median mobile Performance, this WordPress client cohort (62) sits above our Shopify (51) and Magento verified (58) lab samples. LCP remains the shared failure mode across all three. Prefer same-method comparisons over mixing CrUX pass rates with lab averages.
Should we chase unused CSS before hosting?
In this opportunity list, unused JavaScript, unused CSS, and redirects dominate. Hosting still matters for TTFB in the field, but the lab queue on these client sites is mostly front-end weight and redirect hygiene.
CTA
If you manage WordPress clients, the useful move after these tables is to pull one domain report, mark where it sits versus the medians, and put lab LCP plus unused JavaScript on the next sprint board with a scheduled re-test. WordPress Performance Monitoring: The Complete Guide is the operational companion. Start a trial at sign-up when you want that multi-page lab baseline on a schedule rather than another one-off homepage PageSpeed Insights run.
References
CrUX methodology (Chrome for Developers)
Understanding Core Web Vitals and Google search results (Google Search Central)
Core Web Vitals Statistics 2026 (HostingStep)
CMS Core Web Vitals 2026 (PageSpeed Matters)
Core Web Vitals Benchmarks for Shopify Stores (2026 Data) (Apogee Watcher)
Core Web Vitals Benchmarks for Magento Stores (2026 Data) (Apogee Watcher)
Core Web Vitals Benchmarks for Fashion Stores (2026 Data) (Apogee Watcher)
WordPress Performance Monitoring: The Complete Guide (Apogee Watcher)
WordPress Site Slow? It Is Not Always the Hosting (Apogee Watcher)
WordPress Speculation Rules and Prerender vs Core Web Vitals (Apogee Watcher)
What Are Core Web Vitals? A Practical Guide for 2026 (Apogee Watcher)
The Complete Guide to Performance Budgets for Web Teams (Apogee Watcher)
PageSpeed Monitoring: How to Schedule Test Frequency and Priority Across Your Portfolio (Apogee Watcher)
Internal only - do not publish
Calendar: Watcher #101 / Sat 7 Nov 2026.
Cohort: 101-wordpress-benchmark-analysis.json (prod 2 Nov 2026); n=381 client WordPress + latest domain report; 7278 page runs.
Charts: CDN 101-wordpress-lighthouse-performance.webp, 101-wordpress-mobile-lab-cwv-medians.webp, 101-wordpress-lighthouse-opportunities.webp.
Pass 0 / 0.5: 101-serp-brief.md (agency_tech_lead, journey diagnose).
Passes: 1–4, 4b–4d complete (2 Nov 2026). Not imported.
Links: 41, 60, 89, 06, 11, 45, plus 80 / 83B / 85B.
Voice: British English; §2.21 descriptive how-to; lab ≠ CrUX clocks stated explicitly.