Most Laravel teams already know how to make an app faster. Fewer have a durable way to monitor that speed with Google PageSpeed Insights: a schedule, a place to store scores, and a view of remaining API quota. Spot checks in the browser are fine until a release week, a client asks for last month’s trend, or the Google Cloud console shows you burned the free allowance on retries you never logged.
What follows is the job in order: call the PageSpeed Insights API from Laravel, keep results, schedule the run, and watch usage. The short path starts with raw HTTP or Guzzle while you explore, moves to the open-source PageSpeed Watcher package when you want Artisan commands and migrations without inventing them, and only reaches Apogee Watcher when one application stops being the unit of work and you need many sites, roles, and client reports. Install and command depth live on the package README and the Apogee GitHub Pages notes; here we keep one Scheduler example and the decision criteria.
This sits beside What Is Automated Web Performance Monitoring? (why schedules beat paste-and-forget) and Key Metrics in Web Performance Monitoring (what to store once the API answers). It is not a guide to Horizon, Telescope, or application APM: those tools watch queues and request latency inside Laravel, whereas PageSpeed Insights watches how a URL paints and responds under Google’s lab (and field) rules. Mixing the two jobs is how a team ends up with excellent job dashboards and still no history of Lighthouse scores after a release.
What PageSpeed Insights monitoring means in a Laravel app
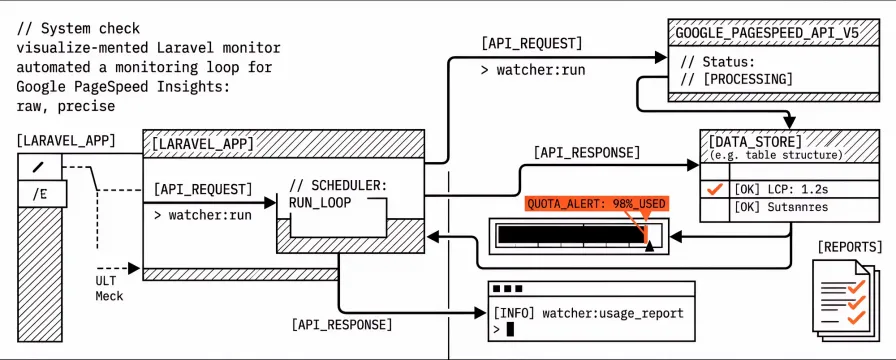
PageSpeed Insights monitoring, in this sense, is a repeatable loop: pick URLs your Laravel app serves (or that you care about as an origin), call the PageSpeed Insights API, persist the response fields you need for history, and account for each request against your Google quota. Lab scores and Lighthouse categories sit next to Core Web Vitals-style fields such as LCP, INP, and CLS when the payload includes them. Field data from the Chrome UX Report can appear in the same API response when Google has enough samples; treat that as a second clock, not a replacement for the lab row you just stored.
In a Laravel setup that loop usually means environment configuration for the API key, a table (or tables) for pages and results, Artisan commands you can run by hand or from the Scheduler, and a usage counter so watcher:usage-style output tells you how close you are to the daily limit. Without those pieces you have a script, not monitoring. With them you can answer “what did mobile Lighthouse performance do after Thursday’s deploy?” without opening ten browser tabs.
Keep the scope honest: a package that tests your own application’s routes is not a multi-tenant agency console. Crawl discovery across client hostnames, budgets with alerts, white-label PDFs, and role-based access belong in a different product. Confusing those jobs is how teams either under-build (spreadsheet forever) or over-build (half a SaaS inside app/).
Raw HTTP or Guzzle: what you end up building
Calling https://www.googleapis.com/pagespeedonline/v5/runPagespeed with Guzzle or Laravel’s HTTP client is a fair first afternoon. You pass a URL, a strategy (mobile or desktop), and your API key. You decode JSON. You print a score. That proves the key works and that your network path reaches Google.
The second afternoon is where the cost shows up. Retries for 429 and 5xx have to protect the quota instead of hammering it, and timeouts have to match slow Lighthouse runs rather than a default that cuts the request mid-audit. History wants a migration for pages and another for results; operations want a command that accepts --url and --strategy, plus another that loops stored pages. Add a daily usage row so nobody discovers the limit when a client demo fails, and host checks so a typo does not send paid requests to someone else’s site. None of that is exotic, but all of it is duplicated work every time a Laravel shop “just wires PSI quickly.”
Therefore raw HTTP is a learning path, not a maintenance plan. Keep a throwaway client if you are validating a key or teaching a junior how the API looks, but move on when you want schedule, storage, and quota as named artefacts in the app rather than ticket leftovers. The package path below exists for that second stage.
Recommended path: the PageSpeed Watcher Laravel package
We open-sourced PageSpeed Watcher for Laravel (apogee/laravel-pagespeed-watcher) so that schedule–store–quota loop does not start from an empty app/Services folder. The package supports Laravel 11, 12, and 13 (PHP 8.2+; Laravel 13 needs PHP 8.3+). It ships a PSI client with configurable retries, migrations for watcher_pages, watcher_test_results, watcher_settings, and watcher_api_usage, and Artisan commands for a single URL, usage, route discovery, and batch runs.
Install from Packagist when available, or via a VCS repository pointing at the GitHub repository. Publish the config and migrations, set PSI_API_KEY in .env, migrate, then smoke-test with php artisan watcher:test-page. Full environment tables, flags such as --json, route discovery patterns, and metric columns (including Total Blocking Time and Speed Index) are documented in the README and in the 14 November 2026 package update. We keep that depth there on purpose so the Watcher blog does not fork into a second, stale command manual.
What the package includes is the PSI client behaviour, usage tracking, CLI commands, route-based page discovery into watcher_pages, and the schema those commands expect. What it leaves out is the multi-tenant product UI, sitemap crawl across arbitrary client domains, budgets and alert policies, white-label reporting, and hosted dashboards. That split is deliberate: one Laravel application monitoring its own pages is a Composer problem, but a portfolio of client sites with roles and PDFs is a product problem.
Path comparison at a glance
| Approach | Fits when | You maintain | Weak for |
|---|---|---|---|
| Raw HTTP / Guzzle | Exploring the API for a day | Everything: retries, schema, commands, quota | Ongoing monitoring |
| PageSpeed Watcher package | One Laravel app (or a small set of its URLs) | Config, Scheduler entry, API key, your pages | Agency multi-tenant UI and client PDFs |
| Apogee Watcher SaaS | Many sites or clients, shared quota, roles, reports | Sites and thresholds in the product | Replacing in-app checks you still want in CI |
Scheduler example: run stored page tests daily
After pages exist in watcher_pages (seeded by hand or via watcher:discover-routes), the batch command is watcher:run-tests. Wire it once in Laravel’s Scheduler so monitoring is not a memory exercise. A command you only remember to run after a bad client call is not a schedule; it is a ritual that fails on holiday weeks.
In routes/console.php (Laravel 11+) or the equivalent Kernel schedule method:
use Illuminate\Support\Facades\Schedule;

Schedule::command('watcher:run-tests --strategy=both')
    ->dailyAt(config('watcher.daily_test_time', '07:00'))
    ->timezone(config('watcher.default_timezone', 'Europe/Luxembourg'));
The application’s cron entry still needs php artisan schedule:run every minute, the same as any other scheduled command. A narrower window usually means --strategy=mobile or a --pages= list; CI logs read better with --json when nobody will stare at the console table. Discovery flags, same-host enforcement, and retry environment variables stay in the package docs. The product idea that belongs here is simpler: one daily (or chosen cadence) run that writes rows you can query later.
If Cloudflare or another edge challenges Google’s lab agents, allowlisting and challenge behaviour matter before you blame the package. Lab runs that return a security interstitial look like “PSI is broken” in the logs when the real fix is an allowlist or a challenge bypass for Google’s fetchers. See Cloudflare and PageSpeed Insights automation when runs fail with security pages instead of Lighthouse JSON.
Quota and usage: watch the API budget
Every PageSpeed Insights API call counts. Retries count. Mobile and desktop on the same URL are two calls. A cheerful watcher:run-tests --strategy=both against fifty routes is one hundred requests before breakfast. Google’s free tier and paid overage are documented on the Google Cloud side; the package’s API_DAILY_LIMIT and watcher:usage exist so your Laravel app can show the same story locally instead of only in a Cloud console someone forgot to share.
Run php artisan watcher:usage (add --json for machines) after you enable scheduling. Treat the number as an operations signal: if usage climbs because discovery added more routes than the team intended, trim watcher_pages or narrow strategies before you raise the Cloud quota. The cost of inaction is concrete, because blind schedules either stop mid-month when the limit hits, or they silently bill after someone “temporarily” raised the cap for a demo.
Agency stacks that mix DIY PageSpeed Insights calls with portfolio tools are covered in 3 Agency PageSpeed Stacks for 2026. The Laravel package is the DIY-in-app slice of that diagram, not a stand-in for the portfolio monitor or the RUM layer those recipes describe. Use it when the application you deploy is the thing under test; reach for the rest of the stack when clients and hostnames multiply.
Single Laravel app versus a portfolio: when to graduate
Stay on the package when the unit of work is your Laravel application: a product SaaS, an internal tool, or a single client build where engineers already SSH to the box and own the Scheduler. You want history in your database, commands in your deploy docs, and quota visibility next to the same .env that holds the API key. That is a good home for PageSpeed Watcher.
Graduate toward Apogee Watcher when the unit of work becomes a portfolio: many hostnames, clients who should not share one Google key in one .env, roles beyond “whoever has deploy access,” discovery across sitemaps you do not compile into a Laravel route list, budgets and alerts that non-engineers can read, and PDF or domain reports you send on a retainer cadence. Building that inside every client’s Laravel repository duplicates tenancy, auth, and reporting. Layering a multi-tenant monitor beside the apps is usually cheaper than forking the package into a private SaaS.
The decision is not moral. A strong engineering team can rebuild Watcher’s surface area; the question is whether that rebuild is the product you sell. If monitoring is a supporting job for one app, keep Composer. If monitoring is the service clients pay for across many sites, use the product we already operate on top of the same PageSpeed Insights ideas.
Soft next step
On a single Laravel application, the next move is practical: install the PageSpeed Watcher package, publish config and migrations, set PSI_API_KEY, run watcher:test-page, then add the Scheduler example above. The GitHub Pages update covers discovery, retries, and JSON output when you need that depth. When the book of work is already many client sites, and you need roles and reports without maintaining another product UI, start a trial at apogeewatcher.com/sign-up and keep the package only where an in-app check still earns its place.
FAQ
Is PageSpeed Insights the same as Laravel performance monitoring with Horizon?
No. Horizon and related tools observe queues, jobs, and application metrics inside Laravel. PageSpeed Insights runs Google’s lab (and optional field) analysis against a URL. You often want both; they answer different questions.
Do I need a Google API key?
Yes for automated API calls. Create a key in Google Cloud with the PageSpeed Insights API enabled, store it as PSI_API_KEY (or your own env name for a raw client), and never commit it. Browser pastes on pagespeed.web.dev use Google’s UI quota, not your server key.
Can the package monitor client sites that are not this Laravel app?
You can point URLs at other hosts if configuration allows, but same-host defaults and the product design aim at the application you deploy. Portfolio crawl, tenancy, and client reporting are Watcher SaaS territory.
Where should I put full command documentation?
In the repository README and Apogee’s GitHub Pages package notes. Keep Watcher blog pieces at the job and decision layer so command flags do not drift out of sync with main.
How does this relate to synthetic versus real-user monitoring?
PSI lab runs are synthetic. CrUX field data in the same response is real-user oriented when present. For when to lean on each clock, see When to Use Synthetic vs Real User Monitoring.
References
PageSpeed Watcher package page (Apogee on GitHub)
PageSpeed Watcher: Laravel 13, route discovery, and run-tests (Apogee on GitHub, 14 Nov 2026)
What Is Automated Web Performance Monitoring? (Apogee Watcher)
Key Metrics in Web Performance Monitoring (Apogee Watcher)
3 Agency PageSpeed Stacks for 2026 (Apogee Watcher)
Cloudflare and PageSpeed Insights Automation (Apogee Watcher)
When to Use Synthetic vs Real User Monitoring (Apogee Watcher)