Why Agencies Need a Systematic Approach
If you run an agency managing 10, 25, or 50+ client sites, you can't afford ad-hoc performance monitoring. One missed regression can cost you a client. One undetected CLS issue can silently tank a client's rankings for weeks before anyone notices.
This checklist gives you a repeatable system. Use it for onboarding new clients, for weekly monitoring routines, and as a quality assurance checkpoint before and after major deployments. For metric fundamentals, see What Are Core Web Vitals?; for budget thresholds, see our performance budget and template resources.
How agencies catch Core Web Vitals regressions before SEO and conversions slip
Search Console Core Web Vitals reports are useful confirmation. They are a poor first alert. Field data can lag a deploy, and many URLs never have enough traffic for a clean CrUX row. Agencies that catch regressions early run a three-layer loop, then tell the client in plain language.
Layer 1 — Early warning on scheduled lab (and RUM where you have it)
Do not wait until Google labels a URL Poor. Track LCP, INP, and CLS on the URLs you defend, preferably at the 75th percentile for field data, and set budgets in an early-warning zone before the official Poor thresholds.
Copy-paste starting budgets (agency practice — adjust per client):
| Metric | Good (Google) | Early-warning zone (act) | Poor (Google) |
|---|---|---|---|
| LCP | ≤ 2.5s | 2.5–3.0s | > 4.0s |
| INP | ≤ 200ms | 200–300ms | > 500ms |
| CLS | ≤ 0.1 | 0.1–0.15 | > 0.25 |
Scheduled PageSpeed Insights / Lighthouse runs catch template and third-party changes quickly. Add real-user monitoring (RUM) only where the client will approve a script and you need session-level proof. For how lab and field clocks differ, see When to Use Synthetic vs Real User Monitoring.
Layer 2 — Synthetic checks around every important deploy
Before and after a release on money templates (home, category, product, landing, checkout), compare against the pre-deploy baseline. Alert examples many teams use:
- LCP up more than about 10%
- INP up more than about 15%
- CLS up more than about 0.03
- New third-party scripts or a large JS / transfer-size jump
Treat synthetic checks as regression tests, not as a substitute for field data.
Layer 3 — Confirm with CrUX / Search Console, then notify
When lab (or RUM) says performance is deteriorating, check whether CrUX or the Search Console CWV report is moving in the same direction — knowing field windows can lag. Then send a short client note (template below). Route engineering interrupts with a written policy; paste Slack Alert Policy Template for Web Performance Teams into your ops docs even if your monitor delivers by email today. Put the monthly story into the Client-Ready Core Web Vitals Report Outline.
Client note after a regression (copy-paste)
Subject: [CLIENT] — Performance watch on [URL or page name]

Hi [Name],

We caught a Core Web Vitals change on [page] before it would normally show clearly in Search Console.

What changed: [LCP / INP / CLS] moved from [before] to [after] on [mobile/desktop] ([lab and/or field]).
When: first seen [date/time] after [deploy / tag change / unknown].
Impact: [one sentence for users or conversion path].
What we are doing: [investigation or fix], owner [name], next update by [date].

We will confirm again against CrUX / Search Console as field data catches up.

Thanks,
[Your name]
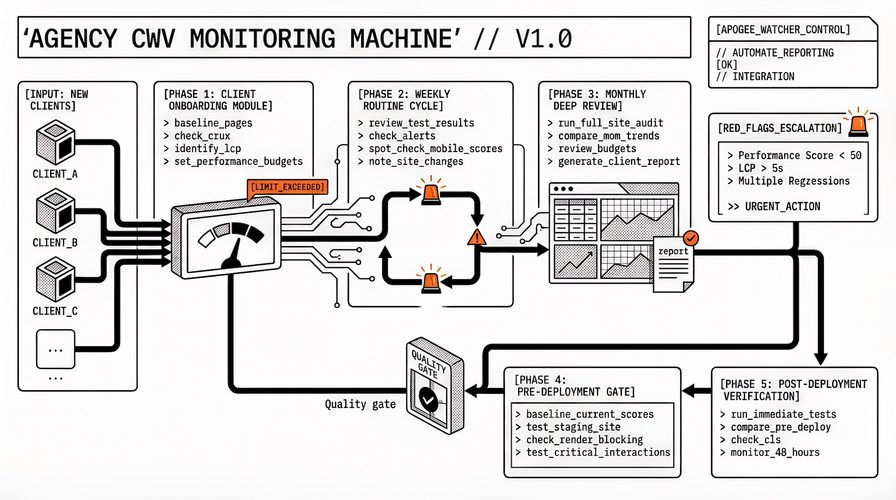
Phases 1–5 below are the recurring checklist. The three layers above are the decision sequence when something moves.
The Checklist
Phase 1: Client Onboarding
Run these checks when you first take on a new client's site.
- [ ] Baseline all key pages — Run PageSpeed Insights (mobile + desktop) on the homepage, top 5 landing pages, and any high-conversion pages (pricing, contact, checkout)
- [ ] Record baseline scores — Document current LCP, INP, CLS, FCP, TBT, and overall Performance Score for each page
- [ ] Check field data availability — Verify whether the site has enough traffic for Chrome User Experience Report (CrUX) field data. If not, lab data will be your primary source
- [ ] Identify the LCP element on each key page — Is it an image? A text block? A video? Knowing this tells you where to focus optimisation
- [ ] Audit third-party scripts — List all third-party scripts (analytics, chat widgets, ads, tracking pixels). Note which ones are render-blocking
- [ ] Check image optimisation — Are images served in modern formats (WebP/AVIF)? Are dimensions set? Are they responsive?
- [ ] Test on real devices — Lab tests on a fast laptop don't reflect mobile experience. Test on a mid-range Android device or use throttled DevTools
- [ ] Set performance budgets — Based on baselines and "Good" thresholds, define target values for each metric:
- LCP: ≤ 2.5s (stretch: ≤ 1.8s)
- INP: ≤ 200ms (stretch: ≤ 100ms)
- CLS: ≤ 0.1 (stretch: ≤ 0.05)
- Performance Score: ≥ 90
- [ ] Set up automated monitoring — Configure daily automated tests for all key pages (both mobile and desktop strategies). Tools like Apogee Watcher show both lab and field data in every test, so you get CrUX real-user metrics alongside Lighthouse scores. If the client has no sitemap: Add key URLs manually; many tools support sitemap + manual URL entry.
- [ ] Configure alerts — Set threshold-based alerts so you're notified when any metric crosses its budget
- [ ] Document the monitoring setup — Record which pages are monitored, which budgets are set, and who receives alerts
Phase 2: Weekly Monitoring Routine
Run through this checklist every week for each client.
- [ ] Review automated test results — Check the latest scores for all monitored pages. Look for any scores that have dropped since last week
- [ ] Check for new alerts — Review any budget violation alerts that fired during the week
- [ ] Verify resolved alerts — Confirm that previously flagged issues have been fixed and metrics are back within budget
- [ ] Spot-check mobile scores — Mobile performance typically lags desktop. Pay extra attention to mobile LCP and INP
- [ ] Review CLS for content-heavy pages — Pages with dynamic content, ads, or frequently updated elements are CLS hotspots
- [ ] Check API usage — If you're on a quota-limited plan, verify you're not approaching your monthly test limit
- [ ] Note any site changes — Were there any deployments, content updates, or plugin changes this week? Correlate with any score changes
- [ ] Update the client if needed — Flag any significant regressions or improvements to the client
Phase 3: Monthly Deep Review
Once a month, go beyond the weekly checks.
- [ ] Run full-site audit — Test all monitored pages, not just the key ones. Look for pages that may have degraded without triggering alerts
- [ ] Compare month-over-month trends — Are scores improving, stable, or declining? Identify patterns
- [ ] Review performance budget targets — Are your budgets still appropriate? Should they be tightened (stretch goals) or adjusted?
- [ ] Audit new pages — Has the client added new landing pages, blog posts, or product pages? Add them to monitoring
- [ ] Re-audit third-party scripts — New scripts get added all the time (marketing tags, A/B testing, chat widgets). Check for new render-blocking resources
- [ ] Check Google Search Console CWV report — Compare field data trends with your lab monitoring data. Treat Search Console as confirmation of the early-warning loop above, not as the only alert source
- [ ] Generate client performance report — Create a summary showing current scores, trends, issues fixed, and recommendations (use the client-ready CWV report outline)
- [ ] Review and optimise alert configuration — Are you getting too many alerts (fatigue) or too few (blind spots)? Adjust thresholds and cooldowns; keep routing rules in your Slack / email alert policy
Phase 4: Pre-Deployment Checks
Run these before any major site change goes live.
- [ ] Baseline current scores — Record current CWV metrics for all key pages before the deployment
- [ ] Test staging environment — If available, run PageSpeed tests on the staging site to catch issues before production
- [ ] Check for new render-blocking resources — Is the deployment adding new CSS/JS files? Are they deferred?
- [ ] Verify image optimisation — Any new images should be compressed, properly sized, and have dimensions set
- [ ] Test critical interactions — For INP: test key interactions (form submissions, menu toggles, search) on the staging site
- [ ] Plan post-deployment monitoring — Schedule immediate post-deploy tests to catch any regressions quickly
Phase 5: Post-Deployment Verification
Run within 24 hours of a deployment.
- [ ] Run immediate tests — Test all key pages on both mobile and desktop within 1 hour of deployment
- [ ] Compare against pre-deployment baseline — Look for any metric regressions
- [ ] Check CLS specifically — Deployments often introduce layout shifts through new elements, changed styles, or updated fonts
- [ ] Verify LCP element — Has the LCP element changed? A new hero section or image could alter LCP behaviour
- [ ] Monitor for 48 hours — Some issues only appear under real traffic. Keep monitoring closely for 2 days after deployment
- [ ] Notify the client — Report on whether the deployment maintained, improved, or degraded performance
Red Flags: Escalate Immediately
- Performance Score drops below 50 — Treat as an incident; something broke
- LCP > 5 seconds — Users are seeing a blank page for too long; urgent
- Multiple pages regress at once — Likely a site-wide change (deploy, new script, CDN issue)
- Client reports "site feels slow" — Correlate with your data; if scores look fine, investigate server/network issues
- Search Console shows sudden CWV degradation — Google has detected a problem; act fast
Per-Client Monitoring Setup Template
Use this template when setting up monitoring for a new client:
// Client Monitoring Setup
Client:          _______________
Domain:          _______________
Setup Date:      _______________
Account Manager: _______________

// Pages Monitored
Homepage:        [URL]
Landing Page 1:  [URL]
Landing Page 2:  [URL]
Product/Pricing: [URL]
Contact:         [URL]
Blog Index:      [URL]
[Custom]:        [URL]

// Performance Budgets
LCP Target:      _____ seconds (mobile) / _____ seconds (desktop)
INP Target:      _____ ms (mobile) / _____ ms (desktop)
CLS Target:      _____ (mobile) / _____ (desktop)
Score Target:    _____ (mobile) / _____ (desktop)

// Alert Configuration
Alert Recipients:    [emails/Slack channels]
Alert Cooldown:      _____ hours
Alert on:            [ ] LCP  [ ] INP  [ ] CLS  [ ] Score

// Testing Schedule
Frequency:       [ ] Daily  [ ] Twice daily  [ ] Weekly
Strategies:      [ ] Mobile  [ ] Desktop  [ ] Both

// Reporting
Report Frequency:    [ ] Weekly  [ ] Monthly
Report Recipients:   [emails]
Report Format:       [ ] PDF  [ ] Email summary
Scaling This Process
This checklist works for 5 clients or 50. The key is automation:
- Automate testing so you're not running manual PageSpeed checks
- Automate alerts so issues find you instead of you finding them
- Automate reporting so client communication doesn't eat your week
- Standardize budgets so every client gets the same quality of monitoring
The manual parts — investigating regressions, optimizing pages, communicating with clients — are where your expertise adds value. Everything else should be automated.
Tools like Apogee Watcher are built specifically for this workflow: multi-site monitoring with both lab and field data in every test, performance budgets, automated alerts, and client-ready reports from a single dashboard.
Get this checklist on GitHub
Prefer a forkable copy with GitHub Issue Forms for onboarding, weekly, monthly, and deploy runs? Open these CC0 repos:
- cwv-monitoring-checklist — lightweight checklist and templates
- agency-cwv-playbook-template — full playbook (use as a GitHub template repo)
All Templates & Checklists repos are listed in core-web-vitals-checklists. More Apogee open source: Apogee on GitHub.
FAQ
How can an agency identify Core Web Vitals regressions before they affect SEO and conversions? Do not treat Search Console as the first alert. Run scheduled lab tests (and RUM where approved) with early-warning budgets, compare before/after important deploys, confirm direction with CrUX or Search Console when field data exists, then send a short client note. Use the three-layer sequence above.
How often should agencies run Core Web Vitals checks? At minimum: weekly spot-checks plus automated daily tests for key pages. For high-traffic or conversion-critical sites, run automated tests twice daily. Manual audits are recommended monthly or whenever major changes deploy.
What's the difference between lab data and field data for CWV monitoring? Lab data (Lighthouse, PageSpeed Insights) simulates a single test under controlled conditions. Field data (Chrome User Experience Report) reflects real users. Both matter — lab catches regressions before users see them; field confirms real-world experience. Use both.
When is manual PageSpeed testing enough vs automated monitoring? Manual testing is fine for 1–2 sites or occasional audits. Once you're managing 5+ client sites or running weekly checks, automation saves hours and catches issues immediately instead of when someone remembers to run a test.
Can I use this checklist with any performance monitoring tool? Yes. The checklist is tool-agnostic. Tools like Apogee Watcher, Lighthouse CI, or PageSpeed Insights can execute the tests; the checklist defines the process and what to check regardless of platform.
Ready to automate your agency's Core Web Vitals monitoring? Apogee Watcher is built for agencies managing multiple client sites. Start with a free account — no credit card required.
For the full dated multi-cohort table (Shopify, Magento, fashion, Attention-Free) plus Google and platform field context, see 40+ Core Web Vitals Statistics for 2026.
References
- Core Web Vitals report in Search Console (Google)
- Understanding page experience in Google Search results (Google Search Central)
- Web Vitals (web.dev)
- 40+ Core Web Vitals Statistics for 2026 (Apogee Watcher)
- Client-Ready Core Web Vitals Report Outline
- Slack Alert Policy Template for Web Performance Teams
- When to Use Synthetic vs Real User Monitoring