Automated web performance monitoring is a system that repeatedly measures how pages load and respond, stores those results over time, and notifies someone when agreed thresholds break. It usually combines scheduled laboratory tests (Lighthouse / PageSpeed Insights-style runs on chosen URLs) with field signals when they exist (Chrome User Experience Report or real-user monitoring). The point is continuity: same URLs, same strategies, dated history, and a rule for what happens when Largest Contentful Paint, Interaction to Next Paint, or Cumulative Layout Shift drifts.
That definition is narrower than marketing pages sometimes imply. It is not application performance monitoring for backends. It is not an AI agent that rewrites your theme. It is not a single PageSpeed Insights tab opened the night before a client call. For Core Web Vitals fundamentals, see What Are Core Web Vitals?. What follows names the jobs that make monitoring automated, the lab versus field split agencies mix up, and where a one-off speed test stops being enough.
What automated web performance monitoring is
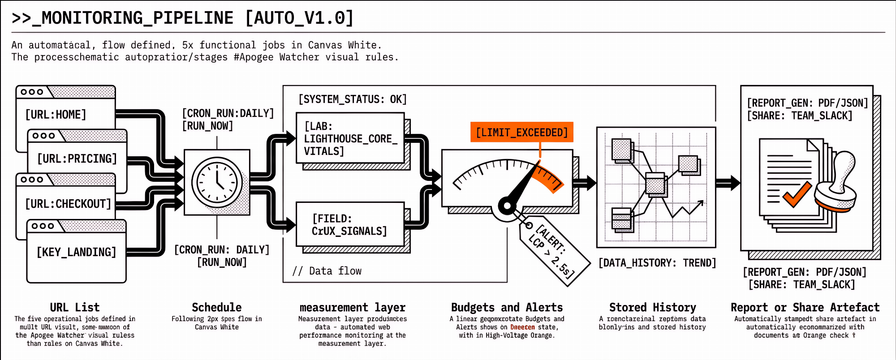
In practice, automated web performance monitoring has five durable parts. Miss any one of them and teams quietly return to screenshots and memory. The list below is the operational checklist we use when a retainer claims “monitoring” but the work still looks like a scramble.
A URL list that matches money paths. Home, pricing, checkout, and key landing pages repay the work; homepage-only vanity rarely does.
A schedule. Daily, weekly, or denser runs on mobile and desktop as needed, not “when someone remembers.”
Stored history. Scores and metrics you can trend and compare across releases, not a fresh zero every time.
Budgets and alerts. Thresholds you agreed in advance, plus notification when a metric breaches, with enough cooldown that teams do not mute the channel.
A report or share artefact. Something an account lead can send without rebuilding a deck from raw JSON.
Those five jobs are what “automated” means here. The schedule runs without a human clicking Analyse. The budget language stays stable across months. The alert reaches the person who can open a ticket. The report carries dates and URLs a sponsor can read. For why agencies adopt that loop instead of ad-hoc checks, see Why Agencies Need Automated Performance Monitoring in 2026. Setup steps for multi-site portfolios live in How to Set Up Automated PageSpeed Monitoring for Multiple Sites.
Automated PageSpeed monitoring is the same idea with a PageSpeed Insights-shaped measurement layer: laboratory Lighthouse metrics on each run, plus CrUX field categories when the origin has enough traffic. Agencies use that shape because clients already recognise PageSpeed language, and because Google’s public tooling already mixes lab and field in one response. Naming it “automated PageSpeed monitoring” keeps the conversation on schedules and budgets instead of on a vague promise to “watch speed.”
What automated web performance monitoring is not
Clear boundaries save bad tool buys and bad retainer scopes.
It is not a one-off PageSpeed Insights run. Opening PageSpeed Insights once diagnoses a URL at one moment. Automation requires repetition, storage, and a response path when numbers move. Spot checks remain useful for investigation; they are not a monitoring system.
It is not APM. Application performance monitoring watches servers, traces, and services. Web performance monitoring watches page experience for visitors: load, interactivity, and layout stability. Teams often need both. Confusing them produces either a backend tool forced into CWV reporting, or a front-end schedule that never explains API latency.
It is not an auto-fix bot. Monitoring tells you when LCP on /checkout left budget. It does not ship image compression, remove a tag manager container, or rewrite a Magento theme. Fixes stay human (or a separate delivery project).
It is not uptime-only monitoring. HTTP 200 on the homepage does not mean Core Web Vitals are healthy. Uptime and SSL checks answer availability. Performance monitoring answers experience. Many agencies run both; they answer different questions.
It is not a full SEO suite. Rankings, crawl budgets, and backlink graphs belong elsewhere. Performance monitoring layers beside Search Console and rank trackers rather than replacing them. Keep the performance chapter ritualised the same way you already ritualise rankings.
Lab schedules and field data in the same system
Readers ask whether automated monitoring is “synthetic” or “real user.” The honest answer is that durable programmes use both clocks, labelled separately.
| Clock | What it measures | Typical source in a PageSpeed-shaped stack | Best use |
|---|---|---|---|
| Lab (synthetic) | Controlled run on a chosen URL and strategy | Scheduled PageSpeed Insights / Lighthouse | Regression after deploy; comparable history; budgets you can retest tomorrow |
| Field (RUM / CrUX) | What real visitors experienced over a window | CrUX in PageSpeed Insights, Search Console, or first-party RUM | Experience Google associates with the origin; catch device and network mix lab misses |
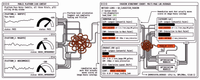
Lab answers “what happens when we retest this URL under our conditions?” Field answers “what did users actually experience in the last collection window?” Mixing them into one green/amber story without labels is how client reports lose trust. For when to lean on each clock, see Synthetic Monitoring vs Real User Monitoring: When to Use Each. Account leads who keep the clocks labelled spend less time arguing about whose screenshot was “right.”
Apogee Watcher is monitoring-first on the PageSpeed Insights path: scheduled lab runs across organisations and sites, with CrUX field data when the origin qualifies. Where a client already runs specialised real-user monitoring, the right move is usually to layer portfolio schedules beside that RUM, not to rip it out. That “layer, don’t replace” rule also applies to Lighthouse CI merge gates and to Search Console field reports.
The jobs that make monitoring automated
Schedules and page discovery
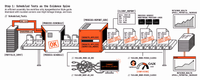
Automation starts when URL coverage stops depending on a sticky note. Manual entry works for a handful of pages. It fails when a client has hundreds of templates. Sitemap-driven discovery, plus filters and excludes, keeps the monitored set aligned with what shipped. Frequency should match change risk: denser around release weeks, lighter for stable brochure sites.
Performance budgets
Budgets turn numbers into decisions. “Mobile LCP on checkout under 2.5 seconds” is something a retainer can renew against. “We will keep improving PageSpeed” is not. Budgets belong in writing with the client once, then reuse the same language every month. Without that contract language, every red number becomes a taste debate in the review call.
Alerts and cooldowns
Alerts exist so humans do not stare at dashboards. Email digests are enough for many agency portfolios today. Slack and webhook delivery may sit on a product roadmap; state that honestly in pitches rather than implying a full incident stack you have not shipped. Cooldowns matter: without them, teams mute channels after the third identical breach.
History and reports
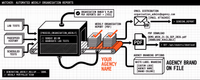
History is what makes last month’s story comparable to this month’s. Reports package that history for sponsors: domain-level summaries for triage, organisation-level weekly PDFs where the product ships them, and a short narrative the account lead still owns. White-label branding, when available on the plan, puts the PDF under the agency name. Monitoring still sits on top of scheduled evidence; branding does not replace Search Console field data.
Automated PageSpeed monitoring for agency portfolios
Agencies and freelancers managing roughly ten to fifty-plus sites feel the gap first. Each client repository can run Lighthouse CI for merge gates. That job is correct and should stay thin. Portfolio surveillance is a different job: production URLs on a calendar, multi-tenant access so clients can view without editing, and reports that do not require a weekend export.
Automated PageSpeed monitoring in that context usually means:
Organisations that isolate clients, with roles such as Admin, Manager, and Viewer.
Sites and pages discovered or curated once, then retested on a schedule.
Shared PageSpeed Insights quota handling so the agency is not farming API keys per client.
Budgets and email alerts that survive staff holidays.
Exports and PDFs that account leads can attach to a retainer review.
Tool choice still depends on whether you need deep single-app RUM, multi-location forensics, or agency-shaped multi-tenant pricing. Feature checklists live in Comparing PageSpeed Monitoring Tools: Features Agencies Need. The definition above stays the same whether you assemble DIY scripts, buy a portfolio monitor, or mix both.
When PageSpeed Insights alone is not enough
PageSpeed Insights remains the right first diagnosis for a single URL. Teams should keep using it for investigation and for teaching clients what Lighthouse and CrUX look like on one page. It becomes the wrong system of record when any of the following is true for your portfolio:
You manage more URLs than you will honestly retest by hand each week.
Two people disagree because they ran different strategies or different days.
Regressions appear days after a deploy and nobody has a dated baseline.
Clients pay for “monitoring” but only receive a scramble before the call.
That threshold is the subject of PageSpeed Insights vs Automated Monitoring: When Manual Checks Aren't Enough. The glossary job here is simpler: once you need schedules, budgets, alerts, and history, you have left one-off testing and entered automated web performance monitoring, whether the product brand on the PDF is yours or a vendor’s. The tool name on the cover matters less than whether those five jobs actually run.
FAQ
What is automated web performance monitoring in one sentence?
A repeating measurement system for page experience (usually lab plus field) with stored history, budgets, alerts, and a report path. It is not a one-time speed test, and it is not a bot that fixes the site.
Is automated PageSpeed monitoring the same thing?
It is the same class of system when PageSpeed Insights (or equivalent Lighthouse lab runs) supply the scheduled measurements, often with CrUX field data in the same workflow. The phrase emphasises the Google PageSpeed-shaped stack agencies already recognise.
Does automated monitoring replace Lighthouse CI?
No. Lighthouse CI protects merges on preview URLs you listed. Automated monitoring watches production (or staging) on a calendar. Keep CI thin; put portfolio surveillance on schedules.
Does it replace Search Console or RUM?
No. Search Console remains a field and indexing source for many SEO conversations. First-party RUM remains valuable where instrumentation is approved. Monitoring-first PageSpeed tools organise lab history and CrUX-in-PSI across many sites; they layer beside those sources.
What metrics belong in automated monitoring?
At minimum the Core Web Vitals your retainer names (LCP, INP, CLS), plus supporting lab metrics you actually budget (for example FCP, TBT, TTFB, performance score). A dedicated metrics shortlist can sit in a later hub; do not invent vanity charts nobody will act on.
Is uptime monitoring enough for Core Web Vitals?
No. Uptime answers availability. Core Web Vitals answer experience. Run both when the retainer promises both.
Start with a definition you can defend in a retainer
Lock the language before you lock the tool. Automated web performance monitoring means schedules, budgets, alerts, history, and a client-readable artefact. Automated PageSpeed monitoring is that loop on a PageSpeed Insights-shaped measurement path. One-off tests, APM, and uptime checks remain useful neighbours; they are not synonyms.
When you are ready to operationalise the definition across multiple client sites, set up automated PageSpeed monitoring, review why agencies need the loop in 2026, and compare features agencies need. For a multi-tenant trial shaped around organisations, schedules, and budgets, start with Apogee Watcher. Keep existing CI gates and Search Console where they already earn their keep.
References
About PageSpeed Insights (Google)
Understanding Core Web Vitals and Google search results (Google Search Central)
Web Vitals (web.dev)
What Are Core Web Vitals? A Practical Guide for 2026 (Apogee Watcher)
PageSpeed Insights vs Automated Monitoring: When Manual Checks Aren't Enough (Apogee Watcher)
Why Agencies Need Automated Performance Monitoring in 2026 (Apogee Watcher)
How to Set Up Automated PageSpeed Monitoring for Multiple Sites (Apogee Watcher)
Synthetic Monitoring vs Real User Monitoring: When to Use Each (Apogee Watcher)
Comparing PageSpeed Monitoring Tools: Features Agencies Need (Apogee Watcher)