The best PageSpeed monitoring tools for agencies are the ones that cover a portfolio without turning into a second job: multi-tenant organisations, scheduled lab tests with CrUX field context where Google publishes it, URL discovery, history, regression alerts, and client-ready reports. One-off PageSpeed Insights and Lighthouse runs stay useful for diagnosis; they are weak as the only system once you manage many retainer sites.
There is no universal winner. DebugBear, Calibre, and SpeedCurve often win when you need deep synthetic work or first-party RUM. GTmetrix wins for location matrices and waterfalls. Apogee Watcher is built for scheduled PageSpeed Insights monitoring across many client sites without per-client API keys. Use the checklist and tables below to score the job you actually have, then confirm limits on each vendor’s site.
Last verified: 7 Oct 2026 for Apogee Watcher product claims in this article (organisations, scheduled PSI lab plus CrUX-in-PSI, discovery, budgets, email digests, weekly organisation PDFs and white-label on plans that include them). Competitor rows are workflow notes, not a live scrape of every pricing page — re-check before you buy.
What to compare in PageSpeed monitoring tools for agencies
Score vendors on operations, not on a single Lighthouse number:
- Multi-tenant organisations — one login for many clients, with roles that stop viewers burning quota.
- Sitemap or crawl discovery — new money URLs do not depend on a forgotten sheet row.
- Lab plus CrUX — scheduled Lighthouse (or PSI) plus real-user CrUX where the URL has enough traffic.
- Historical scores — enough retention for monthly reviews and post-deploy checks.
- Regression alerts — budgets that notify a named owner before Search Console catches up.
- Client reporting — exports, share links, or white-label PDFs account managers can send alone.
- Price at 10–50 sites — flat organisation caps versus per-site or per-monitor maths; for a small-agency ceiling, see Affordable Multi-Tenant Performance Monitoring Under $100/Month.
Retainers break on stale URL lists, per-site licence maths, noisy alerts, and monthly reporting that takes longer than the fix. The rest of this guide sorts tools by job, expands the feature checklist, and links to deeper one-to-one comparisons.
Diagnostics vs monitoring: what to decide first
Before trials, agree which problem you are solving.
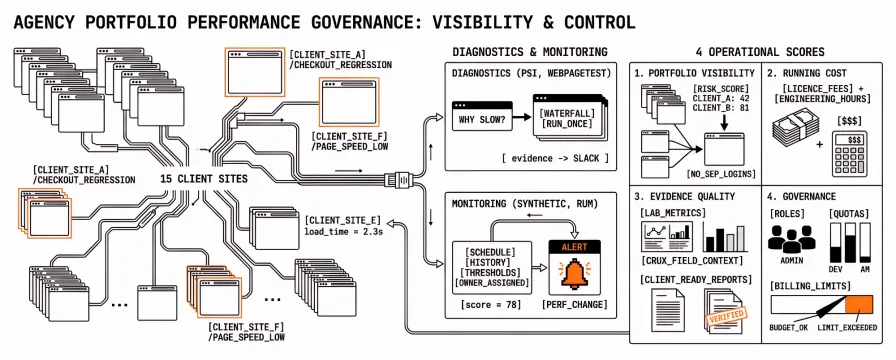
Diagnostics answer: why is this URL slow right now? They give waterfalls, one-off runs, and evidence you can forward in Slack.
Monitoring answers: did performance change on the URLs we defend, and who acts? That needs schedules, history, thresholds, and a named owner.
Stacks fail when diagnostics pretend to be monitoring, or when monitoring runs on a URL list nobody maintains. If that line is still fuzzy, start with PageSpeed Insights vs Automated Monitoring: When Manual Checks Aren't Enough.
For agencies, also score four operational points:
- Portfolio visibility: can you see risk across clients without separate logins?
- Running cost: licence fees plus hours spent on scripts, URL lists, and reports.
- Evidence quality: lab metrics, CrUX field context, and outputs a client understands.
- Governance: roles, quotas, and who can change budgets without breaking billing.
Miss those and you compare scores as if they were interchangeable.
Four types of PageSpeed monitoring tools agencies combine
No single product covers every workflow. Mature teams mix types and keep roles explicit.
Free diagnostics and field reports
PageSpeed Insights, WebPageTest, Chrome DevTools Lighthouse, and Search Console Core Web Vitals reports are strong for quick checks, post-fix proof, and teaching sponsors what LCP or INP mean.
They are weak as the only system for ten retainers: little portfolio history, alerting, or shared workflow. Keep them; do not expect them to run the portfolio.
Longer treatment: Best Free PageSpeed Monitoring Tools.
CI pipelines and custom scripts
Lighthouse CI and cron jobs calling PSI or Lighthouse suit teams that already own deploy pipelines. Thresholds per build work well on templates you control.
The cost shifts to engineering time. Cross-client reporting and account-manager-friendly output usually need another layer. Forum threads often describe “monitoring became a part-time job” once URL counts and client decks enter the picture.
Synthetic monitoring SaaS (scheduled lab, often CrUX)
GTmetrix, DebugBear, Calibre, Oh Dear, SpeedCurve, Treo (CrUX-scale field explorers), PageVitals (WordPress-oriented), PageSpeed Plus–class wrappers, and Apogee Watcher sit here. You get scheduled runs, charts, alerts, and reports without hosting runners yourself. DIY variants (n8n/PSI cron, Unlighthouse sweeps) belong in the same job but shift cost to engineering time — see 3 Agency PageSpeed Stacks for 2026.
Trade-offs are depth per URL versus breadth across sites, whether RUM needs your script on the client site, and how price scales when site counts grow.
Product analytics with Web Vitals (RUM-first)
PostHog Web Vitals and similar stacks read real sessions where instrumentation is allowed. That helps logged-in SaaS flows synthetic tests cannot fully mirror.
On agency retainers, consent, tag managers, and subdomain politics often block one snippet everywhere. Synthetic coverage still matters for public URLs you cannot instrument.
We treat analytics as adjacent: Apogee Watcher vs PostHog Web Vitals.
PageSpeed monitoring feature checklist for agencies
Use this when you compare performance monitoring tools across a portfolio. Every row need not be “yes” on day one; gaps should be conscious.
| Feature | Why agencies care | What good looks like |
|---|---|---|
| Multi-site / multi-tenant dashboard | One login for the portfolio | Organisations, sites, or projects, not one account per client |
| Scheduled tests | Monitoring without calendar rituals | Hourly to monthly per site; mobile and desktop as separate series |
| URL inventory hygiene | CMS and campaigns add routes | Automated discovery (sitemap/crawl) or owned manual lists |
| Lab + field context | Sponsors ask about real users | Lighthouse lab plus CrUX where published for the URL |
| Performance budgets | Scores become pass/fail | Thresholds on LCP, INP, CLS, or scores; breaches trigger alerts |
| Alert routing | Regressions reach a human | Email at minimum; Slack or webhooks if your stack uses them |
| Historical retention | Trends beat screenshots | Enough history for monthly reviews and post-deploy checks |
| Roles and permissions | Managers vs viewers vs billing | Clear RBAC; viewers who cannot burn quota |
| Quota visibility | Sales can outrun API limits | Transparent test counts; per-site or portfolio caps you can plan |
| Client-ready reporting | Renewals need proof | Exports or share links account managers can open alone |
| Prospecting / audits (optional) | New business reuses performance data | One-page domain reports before onboarding, if you sell that way |
| Pricing at 10–50 sites | Per-site fees eat margin | Predictable tiers; clear rules for staging vs production |
Pair the table with How to Schedule Test Frequency and Priority Across Your Portfolio if you are fixing cadence before you buy.
Which Core Web Vitals monitoring tools combine lab testing with CrUX?
Agencies asking for lab testing plus real-user CrUX usually want both clocks in one workflow: synthetic runs that catch a deploy quickly, and field data that confirms whether real Chrome users still see Good LCP, INP, and CLS. Tools that sit on PageSpeed Insights (or equivalent) already return Lighthouse lab metrics and CrUX slices when Google publishes them for that URL. Dedicated synthetic platforms often add their own lab runners and surface CrUX or optional RUM beside them. Confirm the field path on each vendor’s docs — “has a CrUX chart somewhere” is not the same as “every scheduled run stores lab plus field for mobile and desktop.”
| Tool / approach | Lab | Field / CrUX | Agency fit note |
|---|---|---|---|
| PageSpeed Insights | Lighthouse lab | CrUX when available for the URL | Best for one-off diagnosis; weak as the only portfolio system |
| DebugBear | Scheduled Lighthouse / synthetic | CrUX reports; optional RUM | Strong when you need depth or session-level proof on flagship URLs |
| GTmetrix | Deep lab, regions, waterfalls | Field options vary by product path — confirm | Diagnostics and evidence; watch per-account patterns at agency scale |
| Calibre / SpeedCurve | Synthetic budgets | Often RUM plus field context | Premium synthetic + RUM band; see SpeedCurve vs Watcher |
| Treo | Field explorer first | CrUX-scale exploration | Different wedge than scheduled PSI portfolios |
| PageVitals | Lab / monitoring in a WordPress-oriented stack | CrUX where offered | Weigh when the roster is mostly WordPress optimisation |
| Apogee Watcher | Scheduled PageSpeed Insights (Lighthouse lab) | CrUX in the PSI response when Google publishes it | Multi-tenant portfolio monitoring; no first-party RUM |
If your question is only “which tools track LCP, INP, and CLS history for mobile and desktop,” demand separate mobile and desktop series, retained history, and page-level URLs — not a single blended score. Free CrUX Vis and Search Console cover field history; scheduled monitors cover the lab series you can alert on.
Common automated web performance monitoring tools (by job)
When people search for common automated web performance monitoring tools, they usually want a short map — not another undifferentiated “top 10.” Group by job:
| Job | Common tools / approaches | Agency note |
|---|---|---|
| One-off lab + field slice | PageSpeed Insights, WebPageTest, CrUX in Search Console | Keep for diagnosis; weak as the only portfolio system |
| CI gates | Lighthouse CI, custom PSI/Lighthouse in pipelines | Strong on owned templates; weak default client reporting |
| Scheduled synthetic / CWV portfolio | GTmetrix, DebugBear, Calibre, SpeedCurve, Oh Dear, Treo, PageVitals, Apogee Watcher | Compare multi-tenant, budgets, alerts, and price at 10–50 sites |
| DIY automation | PSI API + sheets/n8n, Unlighthouse sweeps | Cheap entry; maintenance and reporting hours return |
| RUM / product analytics | DebugBear RUM, SpeedCurve RUM, PostHog Web Vitals | Needs instrumentation consent; pair with synthetic for public URLs |
Use this article for the checklist and category map. Use 3 Agency PageSpeed Stacks for 2026 when you need named DIY / portfolio / RUM+portfolio recipes after you know the category.
How GTmetrix, DebugBear, PSI, and managed monitors compare for agencies
Read this as workflow fit, not a winner table. Confirm limits on each pricing page. Last verified for Watcher rows: 7 Oct 2026. The comparison is split into two tables so each stays readable: coverage and data first, then operations and agency fit.
Coverage and data: multi-tenant, discovery, lab + CrUX
| Tool / category | Multi-tenant / orgs | Discovery | Lab + CrUX |
|---|---|---|---|
| PSI / WebPageTest | No native multi-client model | Manual URL lists | PSI: lab + CrUX when available |
| Lighthouse CI | Per pipeline / repo | Config-owned URL sets | Lab; field is a separate system |
| GTmetrix | Per-account patterns | Confirm on product | Deep lab; field path — confirm |
| DebugBear | Portfolio projects | Confirm on product | Lab + CrUX; optional RUM |
| SpeedCurve / Calibre | Workspace / project models | Confirm on product | Synthetic + often RUM / field |
| Treo | Explorer accounts | Field / origin focus | CrUX-scale field first |
| Oh Dear | Per-site cost shapes scale | Crawl alongside uptime | Lighthouse among other checks |
| PageVitals | WordPress-oriented | Confirm on product | Lab / CrUX where offered |
| Apogee Watcher | Organisations / workspaces | Sitemap + automated discovery | Scheduled PSI lab + CrUX when published |
Operations and fit: history, reports, when to choose
| Tool / category | History, schedules, alerts | Client / white-label reports | Best when your job is… | Typical friction at agency scale |
|---|---|---|---|---|
| PSI / WebPageTest | Manual or DIY schedules | Screenshots and exports you assemble | Explain one URL; debug after an alert | Manual portfolio passes |
| Lighthouse CI | CI gates, not retainer history by default | Weak default client decks | Block regressions on owned templates in CI | Config ownership; weak AM reporting |
| GTmetrix | Scheduled lab common | Confirm packaging | Deep lab runs, regions, waterfall evidence | Depth vs portfolio breadth (GTmetrix vs Watcher) |
| DebugBear | Strong schedules, history, alerts | Confirm packaging | Premium synthetic + optional RUM | Higher entry price; many sites need discipline (DebugBear vs Watcher) |
| SpeedCurve / Calibre | Budgets and history are core | Confirm packaging | RUM + synthetic with budget | Often ~$90–$500+/mo in community threads (SpeedCurve vs Watcher) |
| Treo | History in the CrUX sense | Not a PSI portfolio reporter | CrUX-scale field exploration / competitor benchmarks | Different wedge than scheduled PSI portfolios (Treo vs Watcher) |
| Oh Dear | Uptime-first alerting | Confirm packaging | Uptime + Lighthouse + crawl together | Per-site cost hurts as client count climbs (Oh Dear vs Watcher) |
| PageVitals | Monitoring in that stack | Confirm packaging | WordPress optimisation + monitoring | Different focus than portfolio-first monitors (PageVitals vs Watcher) |
| Apogee Watcher | Schedules, history, budgets, email digests | Weekly organisation PDFs; white-label on plans that include it; monthly period type still reserved | Scheduled PSI monitoring across many sites, no per-client API keys | No first-party RUM; add RUM elsewhere when you must |
We favour Watcher for portfolio monitoring and still send people to GTmetrix or WebPageTest for location matrices or waterfall forensics on one URL. Deeper splits: GTmetrix vs Apogee Watcher, DebugBear vs Apogee Watcher. For synthetic vs field roles, see When to Use Synthetic vs Real User Monitoring.
PageSpeed monitoring pricing when you manage 5–20 client sites
The invoice line is half the picture.
Per-site or per-monitor fees compound. A tool that felt fine for three domains can double when you add staging, microsites, and campaign landers.
Seat limits bite when account managers need read-only access but must not touch API quotas. “Five seats” often means shared logins or skipped governance.
Test quotas decide whether your monitoring schedule is real. Daily mobile and desktop on twenty URLs is not one test.
Hidden time shows up as spreadsheet exports, Monday PSI rituals, and rebuilding URL lists after CMS migrations. Automated vs Manual PageSpeed Testing: A Time and Cost Comparison puts that in hours.
Ask vendors what month two costs when you add six sites and two viewers. If only sales can answer, note that.
When agencies should keep free PageSpeed tools
Do not drop PSI or WebPageTest when you buy a monitor. Split roles instead:
- Monitor: scheduled baselines on retainer URLs.
- Diagnose: deep runs after a budget breach or a one-off sponsor question.
- Report: monthly narrative tied to thresholds, not a folder of unrelated PDFs.
Core Web Vitals Monitoring Checklist for Agencies templates that split.
When to switch from free tools to managed PageSpeed monitoring
Free and DIY layers are no longer enough as your main system when:
- You run many production sites and cannot see portfolio risk in one place.
- Alerts depend on someone remembering to test.
- URL lists drift after launches while dashboards stay green.
- Client reporting takes longer than fixing the worst regression.
- Different people use different test settings, so trends disagree.
Keep free tools for investigation. Pay for schedules, history, budgets, and roles. Why Agencies Need Automated Performance Monitoring in 2026 covers the operational case.
How Apogee Watcher compares for multi-site agencies
We built Watcher for breadth first: many sites, scheduled PageSpeed Insights runs (Lighthouse lab plus CrUX where Google publishes field data), performance budgets, email digests for budget breaches, automated page discovery (including sitemap-driven inventory), and organisation-scoped roles. We hold the PSI API relationship so your team is not juggling Google keys per client.
Gaps we state plainly: no first-party RUM, no DebugBear-style third-party experiments in-product, and channel depth beyond email digests (Slack, webhooks) depends on what is live on your plan. Weekly organisation PDFs and white-label branding are live on plans that include those flags; a fully automated monthly report period type is still reserved. Confirm current flags on Features, Pricing, and Weekly Organisation Reports and White-Label Branding Options Are Live.
Optional Leads Management adds one-page performance reports and share links for prospects. It supplements monitoring; it does not replace a CRM.
Need session-level proof on one instrumented SaaS app? Pair us with a RUM vendor or lean on DebugBear or SpeedCurve for that lane. Need coverage across many client origins without snippets? That is the problem we optimise for.
Try multi-page reporting without an account at apogeewatcher.com/check.
Deeper PageSpeed tool comparisons on the blog
Use this article to pick categories; use these posts when you are down to two vendors or need a stack recipe:
- GTmetrix vs Apogee Watcher
- DebugBear vs Apogee Watcher
- SpeedCurve vs Apogee Watcher
- Oh Dear vs Apogee Watcher
- Treo vs Apogee Watcher
- PageVitals vs Apogee Watcher
- 3 Agency PageSpeed Stacks for 2026
- Best Free PageSpeed Monitoring Tools
- From Reactive to Proactive: Smart Alerts
- How Lighthouse Performance Scores Are Recorded (score methodology)
FAQ
What are common automated web performance monitoring tools?
Common options fall into five jobs: free diagnostics (PSI, WebPageTest), CI gates (Lighthouse CI), scheduled synthetic SaaS (GTmetrix, DebugBear, Calibre, SpeedCurve, Oh Dear, Treo, PageVitals, Apogee Watcher), DIY PSI/cron stacks, and RUM/analytics (DebugBear RUM, SpeedCurve, PostHog Web Vitals). Pick by job first, then score multi-tenant, alerts, and price at your site count.
What is the best PageSpeed monitoring tool for agencies?
There is no universal winner. WordPress-heavy teams weigh PageVitals differently from teams that need fifteen unrelated domains on one dashboard. Use the checklist above, then pilot two weeks on your noisiest sites. For named stack recipes after this comparison, see 3 Agency PageSpeed Stacks for 2026.
Which PageSpeed monitoring tools combine lab testing with CrUX?
PageSpeed Insights, DebugBear, Apogee Watcher (scheduled PSI), and several premium synthetic platforms surface lab metrics beside CrUX or RUM. GTmetrix, Calibre, SpeedCurve, Treo, and PageVitals each combine lab and field differently — confirm the field path on the vendor’s docs. Use the lab-plus-CrUX table above for the short map.
What should a small web agency compare before buying?
Sites or organisations included, seats that will not force shared logins, whether you get lab plus CrUX (not scores alone), alert channels you will actually watch, report branding or PDF export, and the monthly ceiling at your site count — often under about $100 for early retainers. Affordable Multi-Tenant Performance Monitoring Under $100/Month walks the price-shape decision; this article owns the feature checklist.
How is synthetic monitoring different from RUM?
Synthetic runs hit URLs on a schedule (lab, often plus CrUX). RUM reads sessions where your script runs. Most agencies use synthetic for portfolio coverage and add RUM only where instrumentation is approved. Longer treatment: Synthetic vs RUM.
Is weekly PageSpeed Insights enough for monitoring?
For one site, sometimes. For many sites, weekly manual PSI stays fragile: URLs drift, alerts live in people’s heads, and reporting piles up. Keep PSI; rarely rely on it alone.
Should Lighthouse CI be replaced by a SaaS monitor?
Usually no. CI guards templates you ship; SaaS watches production URLs and client-owned stacks. Use both with clear roles.
How does Apogee Watcher compare on price?
We publish tiers from freelancer to agency scale on Pricing. Premium synthetic/RUM tools often start higher; free tools cost time. Compare licence plus maintenance hours.
Can Watcher run alongside GTmetrix or DebugBear?
Yes. Many teams monitor broadly in Watcher, diagnose in GTmetrix or WebPageTest, and add DebugBear where RUM is required on a flagship site.
Choose the tool type first, then score vendors on the agency checklist. Keep free tools for investigation; put schedules, budgets, and history where regressions cannot hide.
For hosted multi-site monitoring without CI upkeep or per-client API keys, start a free Apogee Watcher account and schedule a baseline this week. For a no-signup domain sample, use the free domain check.