Not every “speed score” measures the same thing, and agencies lose hours when those scores get filed under one green tick.
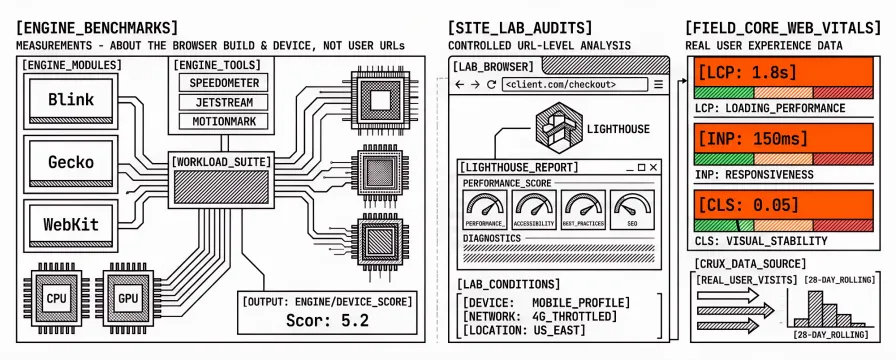
A high Speedometer or JetStream number answers one question: how fast this browser and device run a fixed suite of workloads. It does not answer whether client.com/checkout meets Core Web Vitals for real visitors. The names all sound like “speed,” so vendor decks and Slack threads collapse them. What follows keeps browser engine benchmarks, site-level lab audits, and field Core Web Vitals on separate rows, with a short table and decision rules you can reuse in client reviews.
What Speedometer, JetStream, and BrowserBench actually measure
BrowserBench hosts the main cross-vendor suites that engine teams use to compare Blink, Gecko, and WebKit on shared workloads. Those suites exist for engine and device comparison. They do not care about your theme, CDN, or tag manager. If the slide cannot name a client URL, you are almost certainly in this family of tools.
Speedometer times simulated user interactions on representative web-app workloads: UI work, DOM updates, layout, framework-style paths. Chromium’s Speedometer 3 overview frames the design goal as workloads that look like real sites, so vendors optimise what users feel in the browser chrome itself. A phone that scores well on Speedometer is a better low-end lab device. It still says nothing about Largest Contentful Paint on your product detail page.
JetStream targets compute-heavy JavaScript and WebAssembly: games, simulations, cryptography-style work, framework cores. Chromium’s JetStream 3 write-up puts it beside Speedometer on purpose: UI responsiveness on one side, compute intensity on the other. WebKit’s older JetStream introduction still states the original intent clearly: a repeatable suite for engine developers, not a stand-in for measuring merchant checkout.
MotionMark stresses graphics and animation throughput. WebXPRT and similar device benches compare browsers and hardware on the suite’s own scenarios. In every case the authors chose the workload. Your URLs never appear.
When a client forwards a BrowserBench screenshot, the honest reply is usually short: that score is about the browser build and the device, not about their storefront templates.
What Lighthouse, PageSpeed Insights, and CrUX measure on a URL
Site tools start from a URL you choose.
Lighthouse runs a controlled lab load of that page (and optional flows) and reports Performance plus other categories with diagnostics. Conditions stay synthetic: one device profile, one network profile, one location. That control is why labs help with debugging and regression checks. It is also why they are not a census of every visitor.
PageSpeed Insights wraps Lighthouse lab analysis and, when enough data exists, field metrics from the Chrome User Experience Report for that page or its origin. Lab and field can disagree on the same URL. That disagreement is normal, not a broken tool. web.dev’s lab versus field guide is still the clearest explanation.
Core Web Vitals (LCP, INP, CLS) are the shared language for loading, responsiveness, and visual stability. Definitions and thresholds live in web.dev vitals and in our guides on what Core Web Vitals are and LCP, INP, and CLS. Field CWV come from real Chrome visits over a rolling window. Lab Lighthouse runs approximate related signals under throttle; they do not replace the field distribution.
None of those instruments load Speedometer’s to-do list or JetStream’s compute suite. They load your HTML, CSS, JavaScript, images, and third parties. That is why a green engine suite and a red LCP on checkout can sit in the same week without contradiction.
Browser benchmark vs site audit vs field CWV
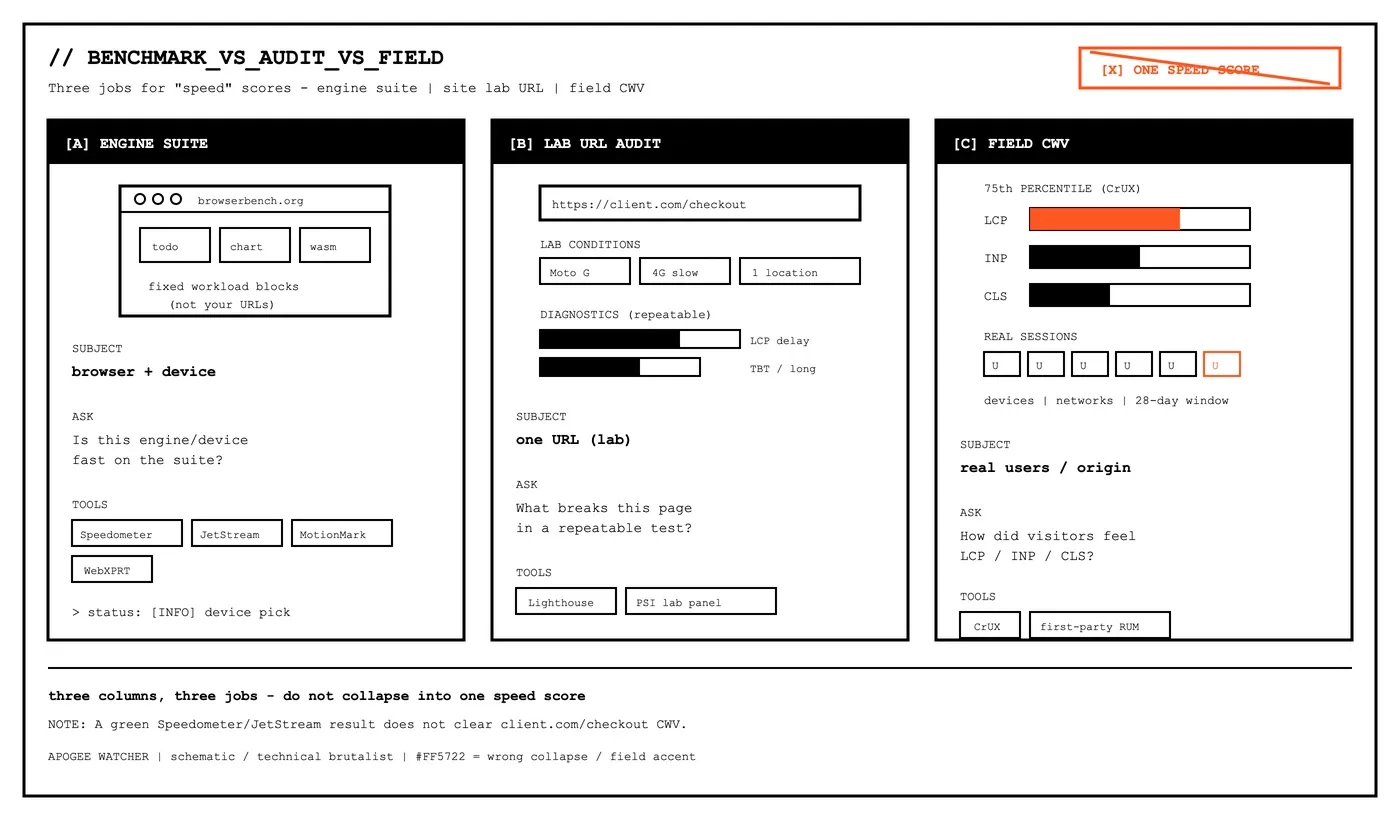
| Artefact | Subject | Typical question | Example tools |
|---|---|---|---|
| Browser engine benchmark | Browser + device on fixed workloads | Is this engine/device fast on the suite? | Speedometer, JetStream, MotionMark, WebXPRT |
| Site lab audit | One URL (or lab flow) under controlled conditions | What breaks this page in a repeatable test? | Lighthouse, PageSpeed Insights lab |
| Field Core Web Vitals | Real users on that URL or origin | How did visitors experience LCP/INP/CLS? | CrUX (incl. in PageSpeed Insights), first-party RUM |
Three rows, three jobs. Collapse them into “we scored well on speed” and the backlog funds the wrong layer; a retainer can burn a sprint before anyone notices the mismatch.
When to use each (and when not to)
Browser benchmarks fit when you compare engines, pick a low-end lab device that matches a weak Speedometer band, or read vendor release notes. They belong in engineering conversations about JavaScript engines and rendering pipelines. They do not belong in a client CWV retainer as proof that a site “passes.”
Lighthouse / PageSpeed Insights lab fits when you need diagnostics on a known URL before or after a deploy: render-blocking CSS, LCP resource delay, long tasks, layout shift culprits. Keep the URL and strategy fixed so trends mean something. Lab is a microscope, not a population study.
Field CWV / CrUX fits when the question is real-user experience and Search’s page-experience inputs. Field needs enough traffic; low-traffic URLs may only show origin-level data, or none. Field also moves when the browser release mix shifts inside the 28-day window, even when nobody deployed. We unpacked that clock in browser release cadence and the field window.
Synthetic versus RUM is a related split inside site measurement: scheduled lab runs versus instrumentation on real sessions. For that decision tree, see synthetic vs real user monitoring. BrowserBench still sits outside both. It never hits your origin.
Why agencies get burned mixing the scores
A common Slack pattern: “Chrome won Speedometer again, so mobile should be fine.” Mobile devices may be faster on the suite. The client’s mobile LCP can still fail because the hero is huge, the font blocks render, or a tag runs before paint. Engine progress and template debt move on different calendars.
Another pattern treats JetStream as evidence that “JavaScript performance is solved.” JetStream exercises compute patterns the suite authors chose. Your cart drawer’s interaction delay is an INP and main-thread story on that page’s scripts, not a JetStream subtest. The fix list still starts from the URL’s long tasks and third parties.
A third pattern pastes PageSpeed Insights once in the same week someone shared a BrowserBench chart, then calls the retainer “covered.” Spot checks and engine screenshots fail the same test: no durable history on the URLs the contract names. For why portfolios need schedules rather than heroic manual runs, see PageSpeed Insights vs automated monitoring. That piece is about cadence and tooling workflows. It is not a Speedometer citation, and it should not be used as one.
In reports, label columns explicitly: Engine suite (informational), Lab (URL), Field (CrUX). If a slide cannot say which row it is, cut the slide. Stakeholders forgive a short pack. They do not forgive a confident number attached to the wrong question.
After deploys: recurring site checks (not another BrowserBench run)
When the question is “did this release hurt checkout?”, the useful next step is another lab run on that URL, plus a field review when CrUX has data. A fresh Speedometer pass on the engineer’s laptop does not answer it. Teams that already schedule Lighthouse or PageSpeed Insights on priority templates catch theme and tag regressions in days, not at the next quarterly panic. Leave the browser suite for device choice and engine release notes.
Keep the monitoring note proportional. Engine benchmarks stay useful for choosing devices and reading browser release impact. Site schedules stay useful for the URLs in the statement of work. Mixing the artefacts in one chart usually confuses stakeholders more than it impresses them.
FAQ
Does a good Speedometer score mean good Core Web Vitals?
No. Speedometer scores the browser on fixed workloads. Core Web Vitals score real (or lab) experience on a specific URL. Both can be “good” or “bad” independently.
Is JetStream related to INP?
Only loosely in spirit: both care about responsiveness under script work. JetStream does not measure Interaction to Next Paint on your pages. INP belongs to field CWV and interaction-aware tooling, not to JetStream leaderboards.
Should we run BrowserBench in CI for client sites?
Usually no. CI that loads client URLs with Lighthouse (or a comparable lab runner) matches the regression question. BrowserBench belongs in browser or device labs.
Why do Lighthouse and PageSpeed Insights disagree with each other, or with CrUX?
Lab configurations differ, and field data is a distribution over real users. See lab vs field and the PageSpeed Insights about page. That disagreement is still inside the “site URL” family; it is not a BrowserBench issue.
Where do MotionMark and WebXPRT fit?
With Speedometer and JetStream: engine and device suites on author-chosen workloads. Useful for hardware and browser comparison; not a substitute for URL-level CWV.
Next step
Before the next client review, put the three-row table on one slide and map every score in the pack to a row. If a number cannot land on a row, leave it out. Then run lab checks on the URLs the retainer actually covers (checkout, search, key landing pages) and read field CWV when CrUX returns them.
A multi-page domain PageSpeed check is enough for a same-day spot check after a deploy. Apogee Watcher fits when those URL checks need schedules, budgets, and history across many client organisations. BrowserBench can stay in the engineering bookmark folder. Client reports need the URL row.
References
BrowserBench (Speedometer, JetStream, MotionMark host)
Speedometer 3: Building a benchmark that represents the web (Chromium)
JetStream 3: A modern benchmark for high-performance, compute-intensive Web applications (Chromium)
Lighthouse overview (Chrome for Developers)
About PageSpeed Insights (Google for Developers)
Web Vitals (web.dev)
Lab data vs field data (web.dev)
What Are Core Web Vitals? A Practical Guide for 2026 (Apogee Watcher)
LCP, INP, CLS: What Each Core Web Vital Means and How to Fix It (Apogee Watcher)
PageSpeed Insights vs Automated Monitoring (Apogee Watcher)
When to Use Synthetic vs Real User Monitoring for Performance (Apogee Watcher)
When LCP Moves and Nobody Deployed: Browser Release Cadence and Your 28-Day Field Window (Apogee Watcher)