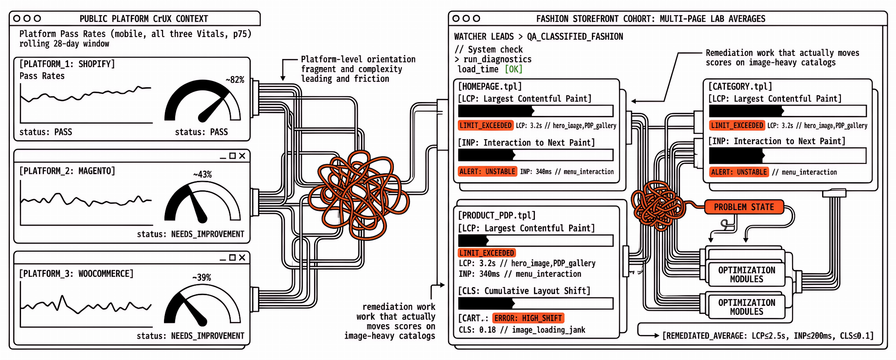
Public Core Web Vitals tables usually label platforms (Shopify, Magento, WooCommerce), not industries. A fashion or apparel agency still needs a different question answered: what do multi-page lab averages look like on clothing storefronts that lean on hero imagery, lookbooks, size guides, and PDP galleries? Platform pass rates remain useful orientation. They do not tell you whether the typical apparel money path clears Google’s lab-friendly gates once you average home, category, and product templates together.
What follows publishes a reproducible sample from Watcher leads classified as fashion / apparel after a QA pass, separates lab averages from CrUX origin categories, and points at the remediation work that actually moves scores on image-heavy catalogs. The method matches our Shopify Core Web Vitals benchmarks for 2026 and Magento Core Web Vitals benchmarks for 2026. For ecommerce metric priorities beyond the three vitals, pair this with Performance Monitoring for E-Commerce: What Metrics Matter Most.
What counts as a reliable fashion Core Web Vitals benchmark in 2026
For Core Web Vitals, the strongest public field source remains the Chrome UX Report (CrUX). Google’s methodology is clear about inclusion: pages and origins must be publicly discoverable and popular enough, data comes from eligible Chrome users, and thresholds are read at the 75th percentile over a rolling window. That is why Search Console and the field section of PageSpeed Insights matter for ranking and real-user claims, while a single Lighthouse run remains a diagnostic tool.
Google’s published thresholds are unchanged for the three metrics:
| Metric | Good (p75) | Needs improvement | Poor |
|---|---|---|---|
| LCP | ≤ 2.5 s | 2.5 s – 4.0 s | > 4.0 s |
| INP | ≤ 200 ms | 200 ms – 500 ms | > 500 ms |
| CLS | ≤ 0.1 | 0.1 – 0.25 | > 0.25 |
An origin or URL group passes Core Web Vitals when all three sit in the good bucket at p75. A Lighthouse Performance score is a different artefact: it blends lab timings under a throttled environment and is useful for regression detection, not as a substitute for CrUX pass/fail. If you need a refresher on the three metrics themselves, start with What Are Core Web Vitals? A Practical Guide for 2026.
A useful fashion benchmark therefore states four things up front: which clock (CrUX field versus Lighthouse lab), which URLs (homepage only versus category, PDP, cart), how scores are aggregated (single URL versus median or mean across pages), and the collection window. Apparel marketing pages and platform health reports often quote pass rates without that scaffolding. Agencies managing twenty clothing clients need the scaffolding more than another green screenshot.
Sources:
Public platform CrUX context versus fashion storefronts
Independent researchers combine HTTP Archive technology detection with Chrome UX Report mobile data and publish platform-level pass rates. Those studies help when your fashion portfolio is mostly one stack. They do not replace an industry cohort when the same agency mixes Shopify boutiques, Magento catalogs, and WordPress shops under one “apparel” retainer.
BootLeads’ August 2026 ecommerce match reports all-three Core Web Vitals pass rates among stores with complete metrics that range from roughly 39% on WooCommerce to about 82% on Shopify, with Magento near 43%. Store2x’s July 2026 shop-system comparison places Magento near the bottom of the pack on “all Core Web Vitals” among detected shops (about 52% in that sample). Neither dataset is fashion-labelled. Treat them as platform context when your clothing clients share a CMS, then measure the apparel URL set you actually manage.
Fashion storefronts add load that platform medians hide: large hero and lookbook imagery, zoom and gallery scripts on PDPs, size-guide and fit widgets, wishlist and loyalty apps, and seasonal campaign landing pages. Apparel website PageSpeed work usually fails on Largest Contentful Paint and unused JavaScript before it fails on Cumulative Layout Shift. That pattern shows up clearly in the Watcher sample below.
Sources:
Ecommerce Core Web Vitals Benchmarks by Platform (2026) (BootLeads)
Shop System Performance 2026: Core Web Vitals Compared (Store2x)
Multi-page lab sample from Watcher's fashion and apparel leads
We keep fashion and apparel storefronts in Watcher and run multi-page PageSpeed Insights analyses that store Lighthouse lab metrics and CrUX field payloads when Google returns them. For this snapshot we took the latest domain report per lead classified fashion_apparel after a sector pass that used business metadata plus homepage title and meta signals (n = 53 stores with aggregated reports after excluding one clear false positive, core6.marketing). Reports were generated between late August and mid-September 2026.
The cohort is platform-mixed and Shopify-heavy: Shopify 28, unknown / unclassified 12, WordPress 6, Magento 5, Webflow 2. That mix is intentional for an industry cut. It is not a pure Shopify or Magento scoreboard; use the platform posts when you need those splits.
Each report averages Lighthouse metrics across the URLs selected for that domain (median 12 analysed pages per store; 836 page runs in total). Values below are store-level averages of lab runs, not single-URL CrUX p75s. A store that looks healthy on one PDP can still drag the average when category grids and campaign templates are included, which is the usual pattern on fashion catalogs with lookbook and seasonal landing pages.
Mobile and desktop Lighthouse Performance
| Slice | Mobile Performance (avg) | Desktop Performance (avg) |
|---|---|---|
| Minimum | 28 | 35 |
| 25th percentile | 37 | 52 |
| Median | 47 | 64 |
| 75th percentile | 59 | 77 |
| Maximum | 80 | 97 |
| Mean | 50 | 65 |
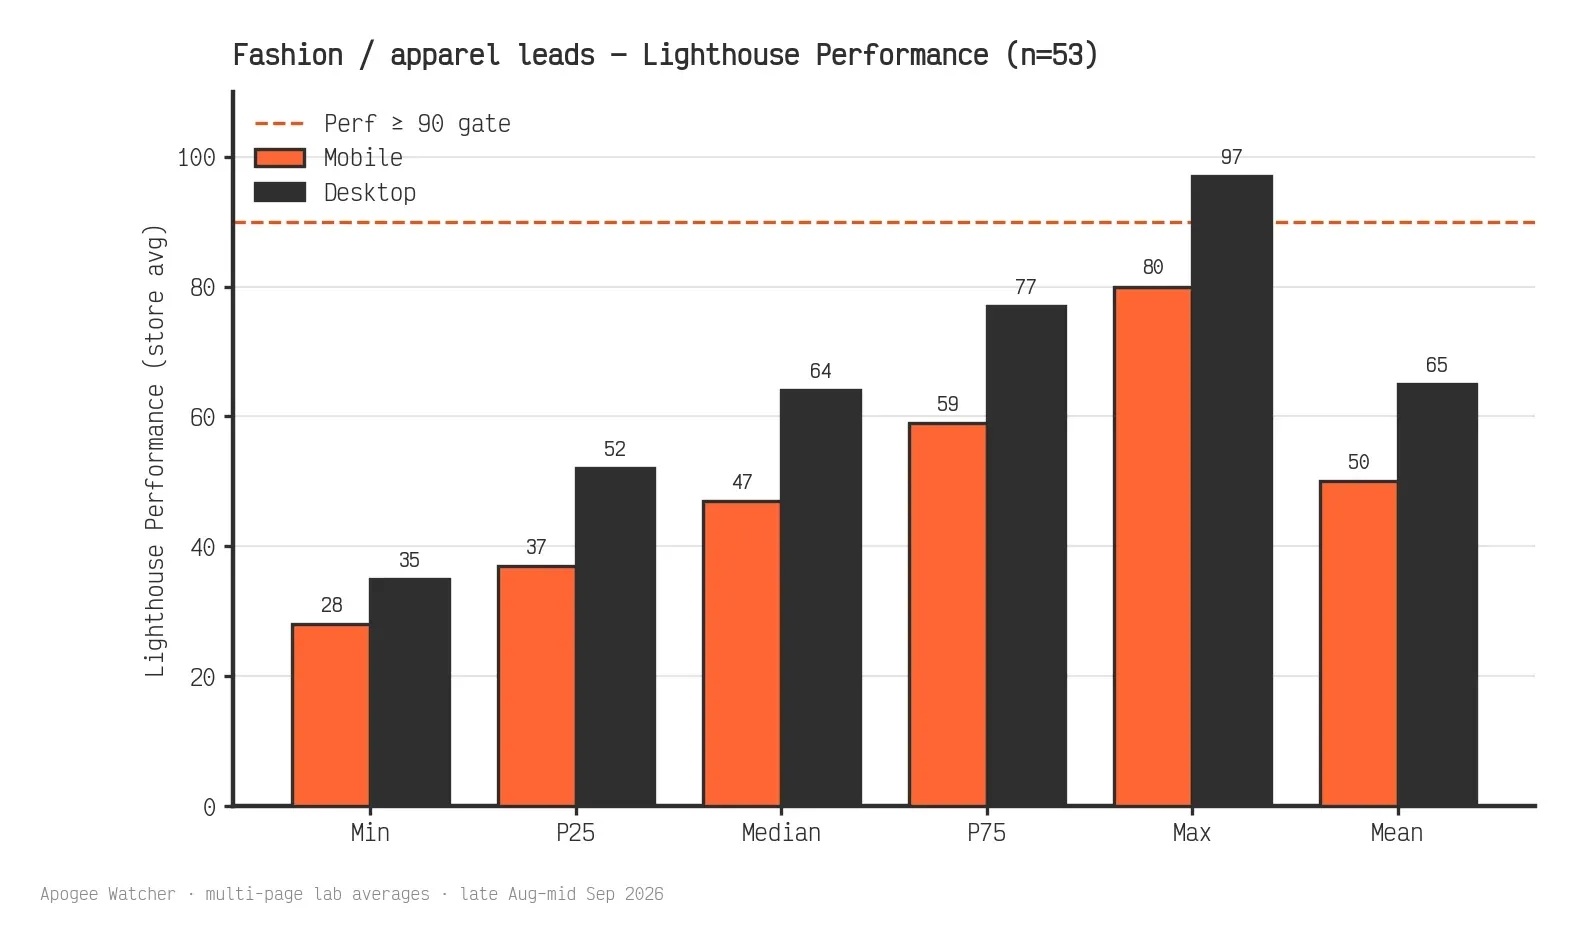
Half of the sample sits at or below a mobile Performance average of about 47. Twenty-five of 53 stores clear a mobile average of 50, five of 53 clear 70, and none of the 53 store averages reached 90 on mobile. Desktop is kinder in the same runs (median about 64), which matches what agencies see when a client forwards a desktop-only screenshot and assumes the clothing site is fine. Compared with our Shopify Watcher sample (median mobile Performance about 51 on 64 stores) and Magento verified sample (median about 58 on 76 stores), this fashion set lands a little lower on the Performance dial. The shared pattern matters more than the gap: multi-page apparel lab averages remain a remediation queue, not proof that the storefront is done.
Mobile lab Core Web Vitals timings (store averages)
| Metric | Median | 75th percentile | Notes in this sample |
|---|---|---|---|
| LCP (s) | 9.5 | 14.0 | 0 / 53 store averages ≤ 2.5 s |
| INP (s) | 0.29 | 0.43 | 14 / 53 store averages ≤ 0.20 s |
| CLS | 0.022 | 0.099 | 41 / 53 store averages ≤ 0.1 |
CLS is often already in a good lab band even when LCP is not. LCP is the structural problem on fashion ecommerce Lighthouse runs. Multi-page mobile averages in the 7–14 s range do not mean every URL fails CrUX at that severity, but they do mean Lighthouse is consistently flagging heavy LCP candidates across apparel templates. That is the signal agencies should take into a remediation backlog before arguing about a two-point Performance score change.
CrUX origin categories when field data exists
Not every lead has origin-level CrUX on the report. Where mobile origin overall category was present (n = 39), we saw 19 FAST, 16 AVERAGE, and 4 SLOW. Origin LCP was FAST on 33 of those stores, INP FAST on 32, and CLS FAST on 37. Field data is often healthier than multi-page lab averages on the same domains, especially for LCP and INP, because lab throttling and averaging across many templates punish media-heavy PDPs that may still pass origin-level CrUX when popular URLs are lighter.
Recurring Lighthouse opportunities
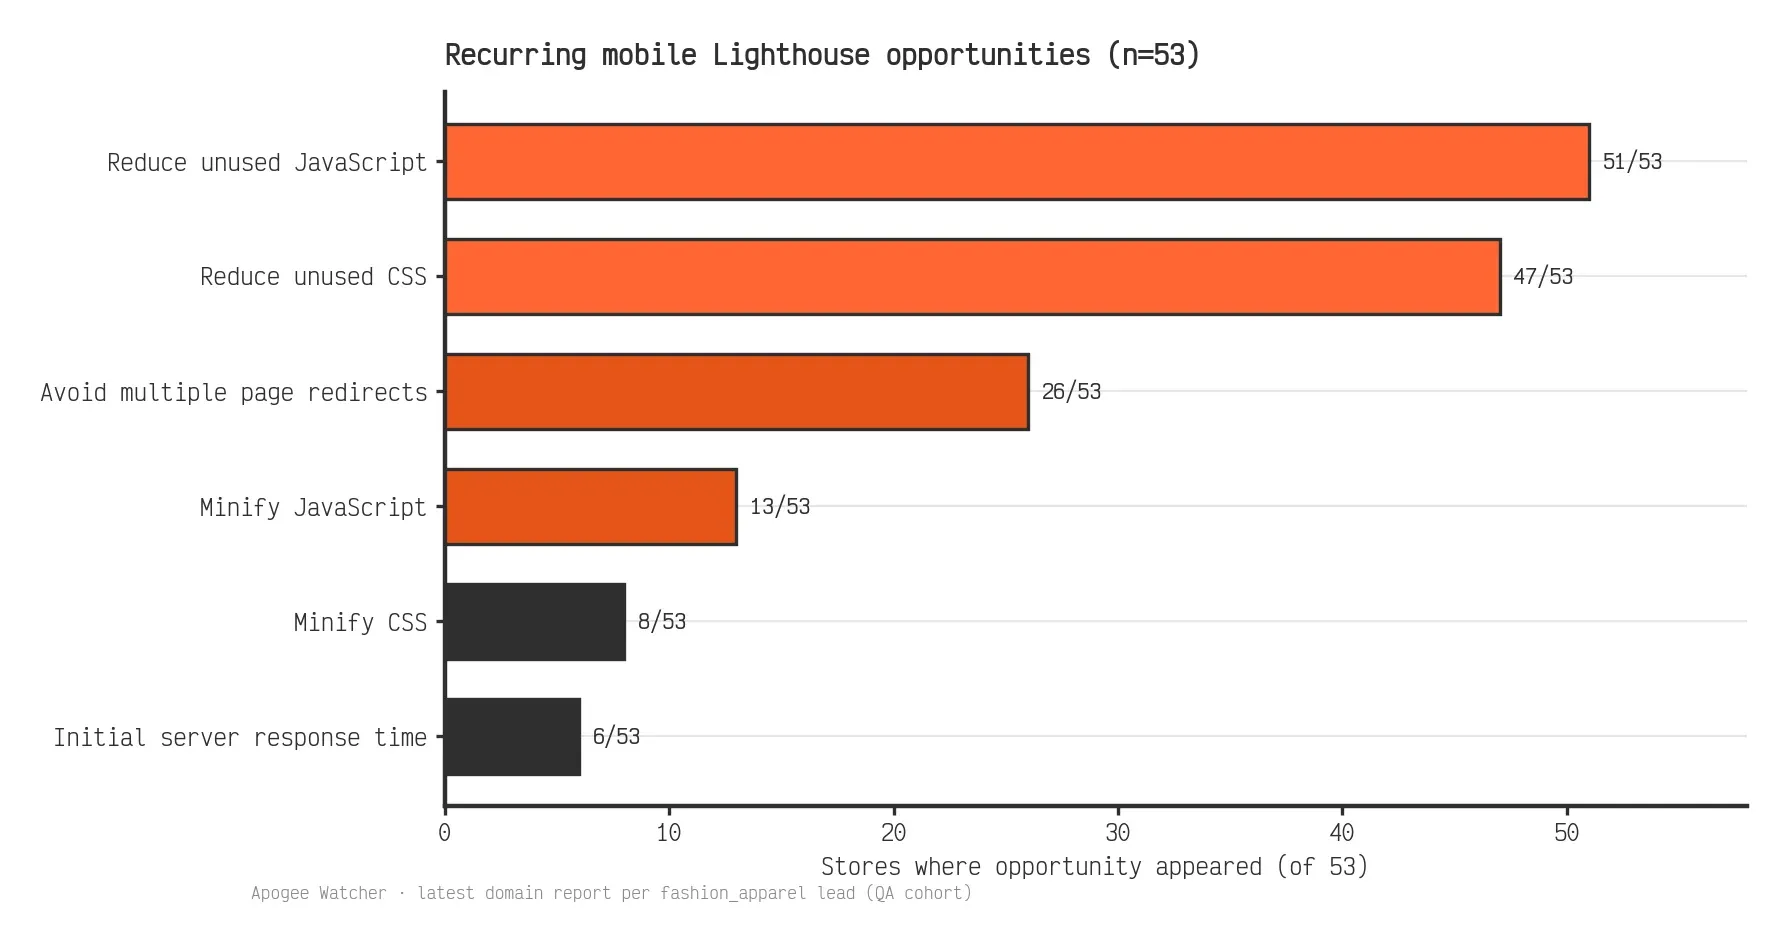
Across the 53 latest reports, the most common mobile opportunities were:
| Opportunity | Stores where it appeared |
|---|---|
| Reduce unused JavaScript | 51 / 53 |
| Reduce unused CSS | 47 / 53 |
| Avoid multiple page redirects | 26 / 53 |
| Minify JavaScript | 13 / 53 |
| Minify CSS | 8 / 53 |
| Initial server response time | 6 / 53 |
Unused JavaScript is effectively the default fashion finding in this sample. Theme and app code, reviews, size guides, chat, personalisation, and campaign pixels compete for the same main thread that INP and Total Blocking Time care about. Redirect chains still show up on enough domains to deserve a separate checklist item when agencies inherit migrated catalogs or multi-locale URL maps.
Attention-Free Score triage on fashion reports
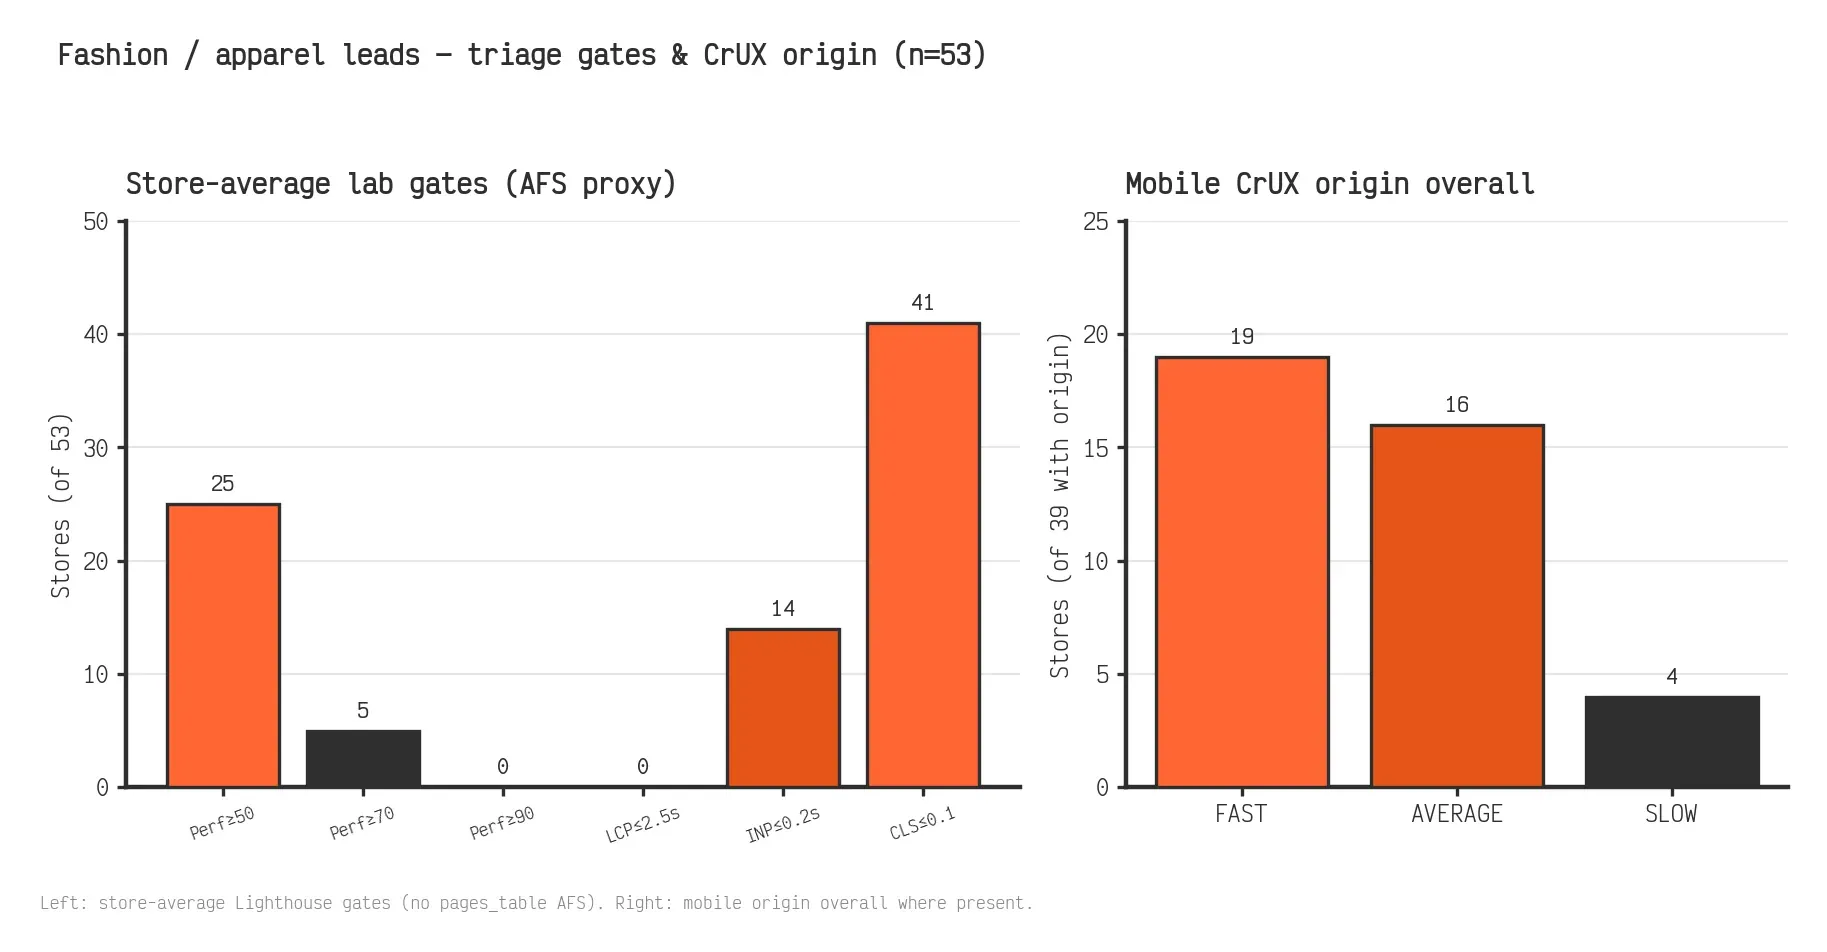
Performance averages answer “how green is the typical page?”. The Attention-Free Score on Watcher domain reports answers a stricter triage question: what share of completed page×device tests pass all lab gates at once (Performance ≥ 90, Accessibility / Best Practices / SEO ≥ 80, LCP ≤ 2.5 s, CLS ≤ 0.1, INP ≤ 0.2 s with Total Blocking Time as a fallback when INP is missing). One hundred percent means no page needs attention on either strategy.
This fashion lead cohort stores multi-page section averages without a full pages table in the aggregated payload, so we cannot republish Attention-Free percentiles the same way as our Magento verified-user sample. The charts above use store-average Lighthouse gates as a blunt proxy alongside CrUX origin overall where present: none of the 53 stores cleared a mobile Performance average of 90, none cleared a mobile LCP average of 2.5 s, and only 14 cleared an INP average of 0.2 s even though 41 cleared CLS ≤ 0.1. Among the 39 origins with a mobile CrUX overall category, 19 were FAST, 16 AVERAGE, and 4 SLOW. A store that fails Perf ≥ 90 and LCP ≤ 2.5 on the average will not clear the joint Attention-Free gate set across most page×device runs. Agencies get clearer decisions when they read Attention-Free as the portfolio triage dial and CrUX as the ranking dial, rather than treating the two as substitutes.
Why fashion Core Web Vitals still vary store to store
Two clothing shops on the same platform can land in different buckets for reasons that never appear in a platform marketing page:
Media strategy. Hero video, lookbook carousels, and unprioritised LCP product imagery dominate mobile LCP in lab runs on fashion retail sites.
App and widget footprint. Size guides, fit finders, reviews, wishlist, loyalty, chat, and A/B tools add script weight on category and PDP templates.
Template mix. A clean homepage can hide a slow collection grid or a script-heavy PDP gallery when you only test one URL.
Platform and theme stack. Shopify themes, Magento frontends, and WordPress builders change what Lighthouse sees even when the catalog category is “apparel”.
Campaign and locale routing. Seasonal landing pages and multi-hop redirects change document timing before paint work begins.
Traffic shape and geography. CrUX inclusion and p75 values move with real visitor mix; lab runs do not.
Industry medians help set expectations in a roadmap review. They do not replace scheduled checks on the URLs that drive revenue. Population CrUX tables stay useful as context; multi-page samples are the day-to-day view we use when an agency asks which fashion client to fix first.
Lab Lighthouse scores versus CrUX field data on fashion stores
Reporting stays clearer when lab and field stay in separate columns:
| Question | Prefer |
|---|---|
| Does Google’s page experience view look healthy? | CrUX / Search Console / PSI field (p75) |
| Did last week’s campaign or app change regress templates? | Scheduled Lighthouse (lab), same URL set |
| Are we comparing to a platform CrUX table? | Population studies with stated n and month |
| Are we comparing agency client A to client B? | Same tool, same URL roles, same aggregation |
Watcher domain reports already separate lab score cards from field methodology notes (median of URL-level p75s where present, origin badge when available). That separation belongs in client decks too. A green origin badge with a mobile Performance average of 45 is not a contradiction; it is a prompt to inspect which apparel templates the lab average is punishing. For portfolio monitoring design, see Core Web Vitals Monitoring Checklist for Agencies and How to Set Up Automated PageSpeed Monitoring.
What to fix first when fashion Lighthouse opportunities repeat
When unused JavaScript and unused CSS dominate the opportunity list, a useful starting set is the money path (home, top category, top PDP, cart, checkout) rather than a homepage-only screenshot contest:
Measure the same URLs on a schedule. Lab averages move when discovery adds templates, so locking the set before debating a three-point Performance change keeps the comparison honest. See How to Schedule PageSpeed Monitoring.
Attack LCP candidates on the worst templates first. Hero and primary product imagery, font loading, and above-the-fold critical CSS usually repay the work; lazy-loading the LCP image is a common apparel misstep.
Shrink the app and theme JavaScript budget. Removing unused modules, deferring non-critical widgets, and challenging each size-guide, review, or chat script on PDP reduces the unused-JS finding that dominates this sample.
Check redirects and HTML caching. Multi-hop locale paths, trailing-slash policies, and cold cache misses show up as redirects or slow document response before paint work begins.
Reconcile with CrUX monthly. If origin field data is FAST while lab LCP is ugly, document which templates are lab-only pain and which URLs Search Console actually groups.
Trimmed apparel storefronts in our sample can still clear mobile lab averages in the mid-70s to low-80s. Heavier lookbook and app stacks land in the high 20s to mid-30s with lab LCP well into double-digit seconds. The industry label is the same; the implementation load is not. For budget language clients understand, see Performance Budget Thresholds Template.
How to run a repeatable fashion CWV cohort each month
A monthly fashion cohort holds up better when the origin list and URL roles stay fixed:
Keep a fixed list of fashion / apparel origins (clients plus any public cohort you track).
Run the same multi-page URL roles every month (home, category, PDP, cart, checkout when reachable).
Publish store-level lab averages and, separately, origin CrUX categories when present.
Track unused JavaScript and unused CSS occurrence counts so app creep is visible.
Annotate releases: theme changes, app adds, CDN changes, and major campaign landing pages.
That schedule turns a one-off benchmark into a monitoring habit. If you want the same workflow without rebuilding spreadsheets, start a free Watcher check or create an account and schedule the money-path URLs you already care about. The charts and tables above are a September 2026 snapshot; the monthly loop is what keeps clothing store Core Web Vitals from becoming another stale slide.
FAQ
What is a good fashion Core Web Vitals score in 2026?
For ranking and real-user claims, use CrUX or Search Console at p75: LCP ≤ 2.5 s, INP ≤ 200 ms, CLS ≤ 0.1. Lighthouse Performance averages in the mid-40s are common on multi-page fashion lab samples and are not a CrUX pass/fail substitute.
Why is apparel website PageSpeed so slow on mobile Lighthouse?
Throttled Lighthouse plus heavy heroes, product galleries, and JavaScript-heavy templates inflate store averages when many URLs are included. Origin CrUX can still look healthier if popular URLs are lighter than the full template set.
Do fashion retail stores usually pass Core Web Vitals in the field?
In this Watcher sample, 19 of 39 origins with mobile CrUX overall category were FAST. That is a lab cohort with field overlays, not a population study. Platform CrUX tables remain orientation only; your client’s origin is the scoreboard that matters.
Is unused JavaScript inevitable on fashion ecommerce?
It is extremely common in our sample (51 / 53 stores), but it is not inevitable. App audits, lighter themes, and deferred non-critical scripts reduce the finding. Count scripts on money-path templates before accepting “fashion sites are just heavy” as the final answer.
How does this compare with Shopify and Magento benchmarks?
Our Shopify Watcher sample (n = 64) showed a median mobile Performance of about 51. Magento verified users (n = 76) showed about 58. This fashion industry sample (n = 53, Shopify-heavy) shows about 47. LCP remains the hard lab problem across all three. Compare like with like: same clocks, same multi-page aggregation.
Should we change platform for clothing store Core Web Vitals?
Not based on a lab average alone. Fix LCP candidates, app weight, and caching first; re-measure the same URL set; then decide whether a theme rebuild or platform change is the cheaper path for that catalog.
What does Attention-Free triage mean for fashion reports?
It means almost every completed mobile and desktop test is likely failing at least one lab gate, usually Performance ≥ 90 and/or LCP ≤ 2.5 s, when you apply the same gates Watcher uses on domain report Summary. It does not mean origin CrUX is automatically Poor. Attention-Free helps prioritise templates; Search Console or PageSpeed Insights field data supports ranking claims.
References
CrUX methodology (Chrome Developers)
Understanding Core Web Vitals and Google search results (Google Search Central)
Ecommerce Core Web Vitals Benchmarks by Platform (2026) (BootLeads)
Shop System Performance 2026: Core Web Vitals Compared (Store2x)
Attention-Free Score: How Domain Reports Show Which Pages Need Work
Performance Monitoring for E-Commerce: What Metrics Matter Most