What Is Automated Web Performance Monitoring?
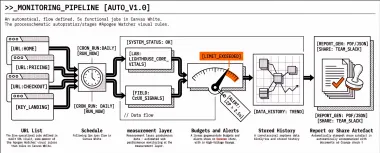
Automated web performance monitoring means scheduled lab and field checks, budgets, alerts, and history, not a bot that rewrites your site, and not a one-off PageSpeed Insights paste.
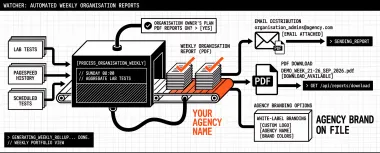
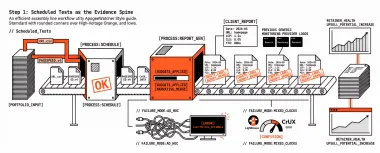
Apogee Watcher now builds weekly organisation portfolio reports on a Sunday schedule, with Preview for the current week, and white-label PDF branding options (logo, colour, font) on Professional+ plans.
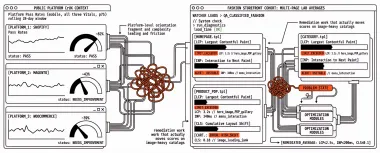
Fashion Core Web Vitals benchmarks for 2026: a 53-store multi-page lab sample from Watcher fashion and apparel leads, CrUX origin context, and a fix order for image-heavy clothing storefronts.
A monthly white-label Core Web Vitals retainer workflow any agency can run (schedule, budgets, narrative), plus which Apogee Watcher report features are live today (weekly organisation PDFs under your brand) without over-claiming monthly automation.
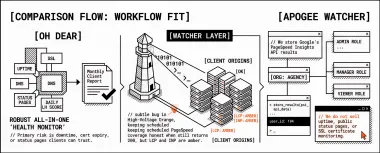
Oh Dear bundles uptime, SSL, status pages, response-time checks, and daily Lighthouse. Apogee Watcher focuses on multi-tenant PageSpeed Insights and Core Web Vitals portfolio monitoring. Here is a fair Oh Dear vs Watcher split, including when to run both.
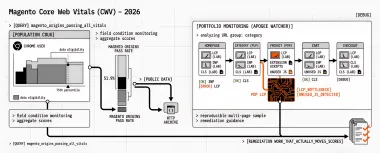
Magento Core Web Vitals benchmarks for 2026: public CrUX context, a 76-store multi-page lab sample from Watcher's verified Magento users, and Attention-Free Score triage stats.
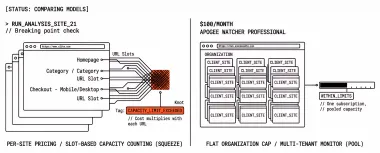
How agencies keep multi-tenant PageSpeed monitoring under $100/month: flat org caps versus per-site tools, honest free-tier limits, and when Professional beats DIY PageSpeed Insights scripts.
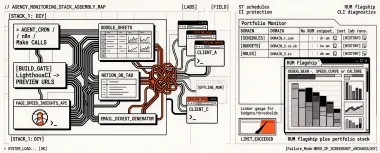
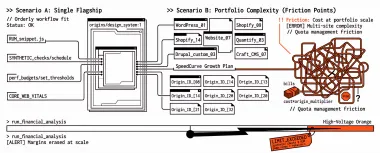
Three PageSpeed monitoring stacks agencies actually run in 2026: DIY (PageSpeed Insights API + Lighthouse CI + n8n), portfolio monitor for multi-site schedules, and RUM flagship plus portfolio long tail. Decision tree by site count, snippet appetite, and reporting hours.
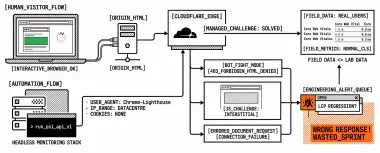
When Cloudflare challenges or blocks PageSpeed Insights automation, lab scores stop describing the client site. Diagnose Bot Fight Mode, allowlists, and origin versus edge so monitoring stays honest.
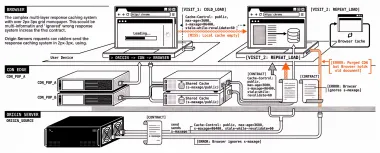
Set Cache-Control by content type: long immutable TTLs for fingerprinted assets, revalidatable HTML, and CDN rules that match origin headers so TTFB and LCP gains survive the next deploy.
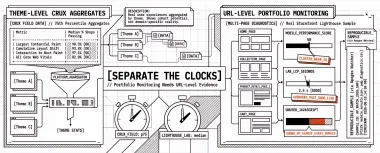
Shopify Core Web Vitals benchmarks for 2026: theme-level CrUX context, a 64-store multi-page lab sample from Watcher Shopify leads, and a famous DTC cohort you can re-measure.
SpeedCurve pairs premium synthetic checks with first-party RUM from $90/mo. Apogee Watcher focuses on multi-tenant PageSpeed Insights monitoring, discovery, and agency roles at a lower entry price. Here is a fair SpeedCurve vs Watcher split, including when to run both.
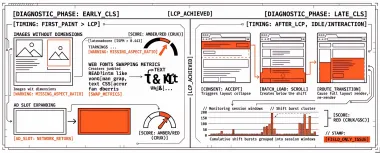
Early CLS comes from load-time sizing and fonts; late CLS comes from dynamic injection, route changes, and interaction-heavy UI. Here is how to split the signal, reproduce cumulative layout shift after load in the lab, and fix what field data actually measures.
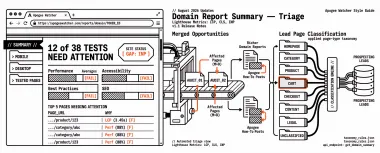
August 2026: domain report Summary tab with attention-free scoring and page-type breakdown, lead page classification aligned with monitored sites, richer domain reports with Watcher how-to links, public help centre at /docs, agent readiness v0 on the marketing site, GTM outreach open tracking, and role gates on manual PageSpeed runs.