Blog / Automated Monitoring

Calibre vs Apogee Watcher: Continuous Monitoring for Agencies
October 22, 2026

Calibre vs Apogee Watcher: Continuous Monitoring for Agencies

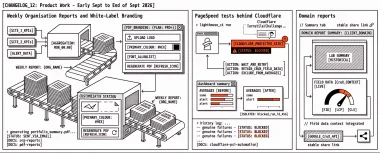
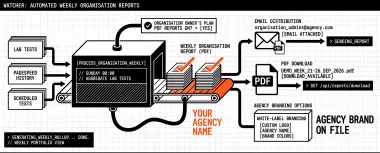
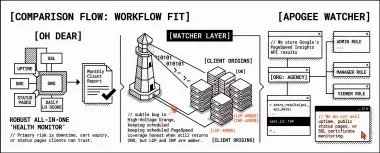
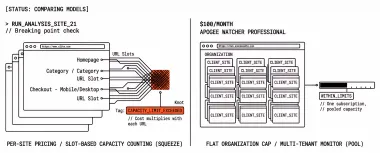
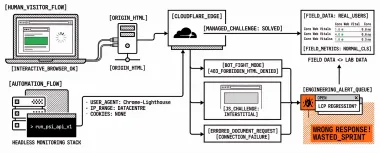
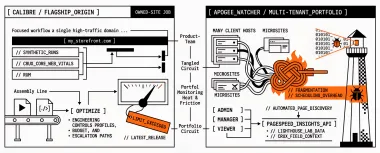
Agencies comparing Calibre and Apogee Watcher need a clear job split: Calibre for continuous synthetic plus RUM on owned high-traffic sites; Watcher for multi-tenant PageSpeed Insights monitoring, discovery, and agency roles at a lower entry price. Here is when to pick each, and when to run both.
Key Metrics in Web Performance Monitoring
October 20, 2026

Key Metrics in Web Performance Monitoring

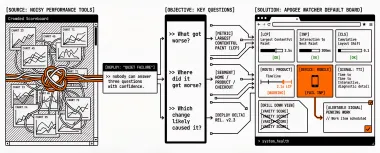
The key metrics in web performance monitoring are Core Web Vitals plus a short supporting set, deploy deltas, and alertable signals. Here is what belongs on the dashboard, and what to leave off.

Partial Page Loads in CrUX: What Field Data Includes (and Excludes)
October 15, 2026

Partial Page Loads in CrUX: What Field Data Includes (and Excludes)

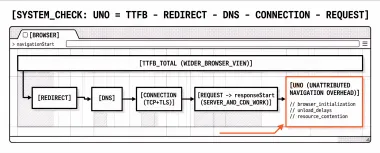
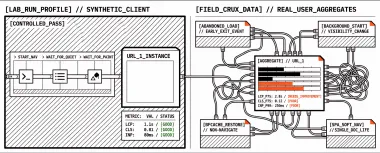
CrUX field percentiles are not a slower Lighthouse run. They aggregate real experiences that may abandon early, start in the background, restore from bfcache, or stay on one SPA document. Here is what partial page loads include and exclude, and how to report lab versus field without mixing the clocks.

Why CrUX Has No Data for Your Site
October 13, 2026

Why CrUX Has No Data for Your Site

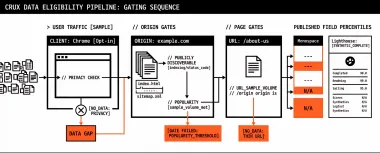
When CrUX has no data for a client site, the problem is usually eligibility, not a broken PageSpeed Insights run. Here is how Chrome UX Report eligibility works, and what to monitor until field data exists.

What Is Automated Web Performance Monitoring?
September 29, 2026

What Is Automated Web Performance Monitoring?

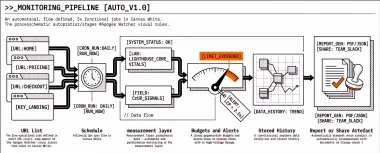
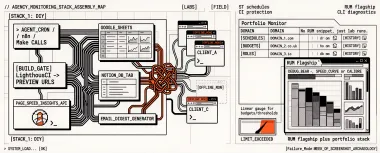
Automated web performance monitoring means scheduled lab and field checks, budgets, alerts, and history, not a bot that rewrites your site, and not a one-off PageSpeed Insights paste.