September ended with weekly organisation portfolio reports and white-label PDF branding on plans that include them. Earlier in the month we changed how scheduled PageSpeed tests behave when Cloudflare protects a client site, and we made shared domain reports easier to refresh. We also made organisation-scoped lead tools available on Agency, added a site Test results tab, Google and magic-link sign-in, and more help centre guides.
Changelog #12 (1 Sep 2026) covered the domain report Summary tab, page-type labels, and the help centre at /docs. This release covers product work from early September through the end of the month. For the announcement on weekly reports and branding, see Weekly Organisation Reports and White-Label Branding Options Are Live.
Weekly organisation reports and white-label branding
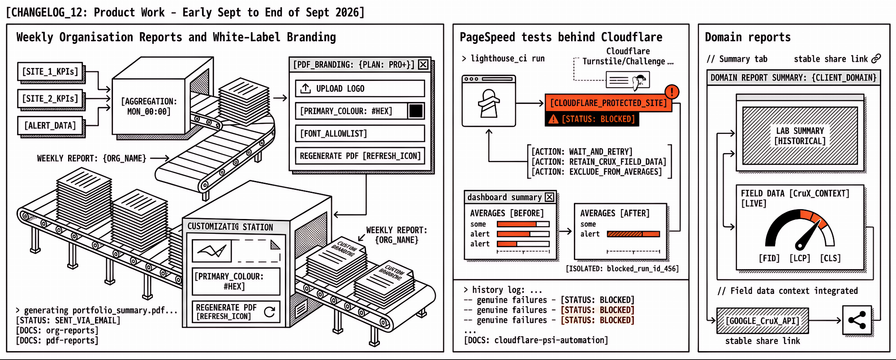
Agencies often need one portfolio view across every client site, instead of separate one-off PageSpeed pastes. Organisations on plans with reporting features now get a weekly portfolio report for the previous complete Monday–Sunday week. Generation runs Monday morning and covers the sites in that organisation for that period.
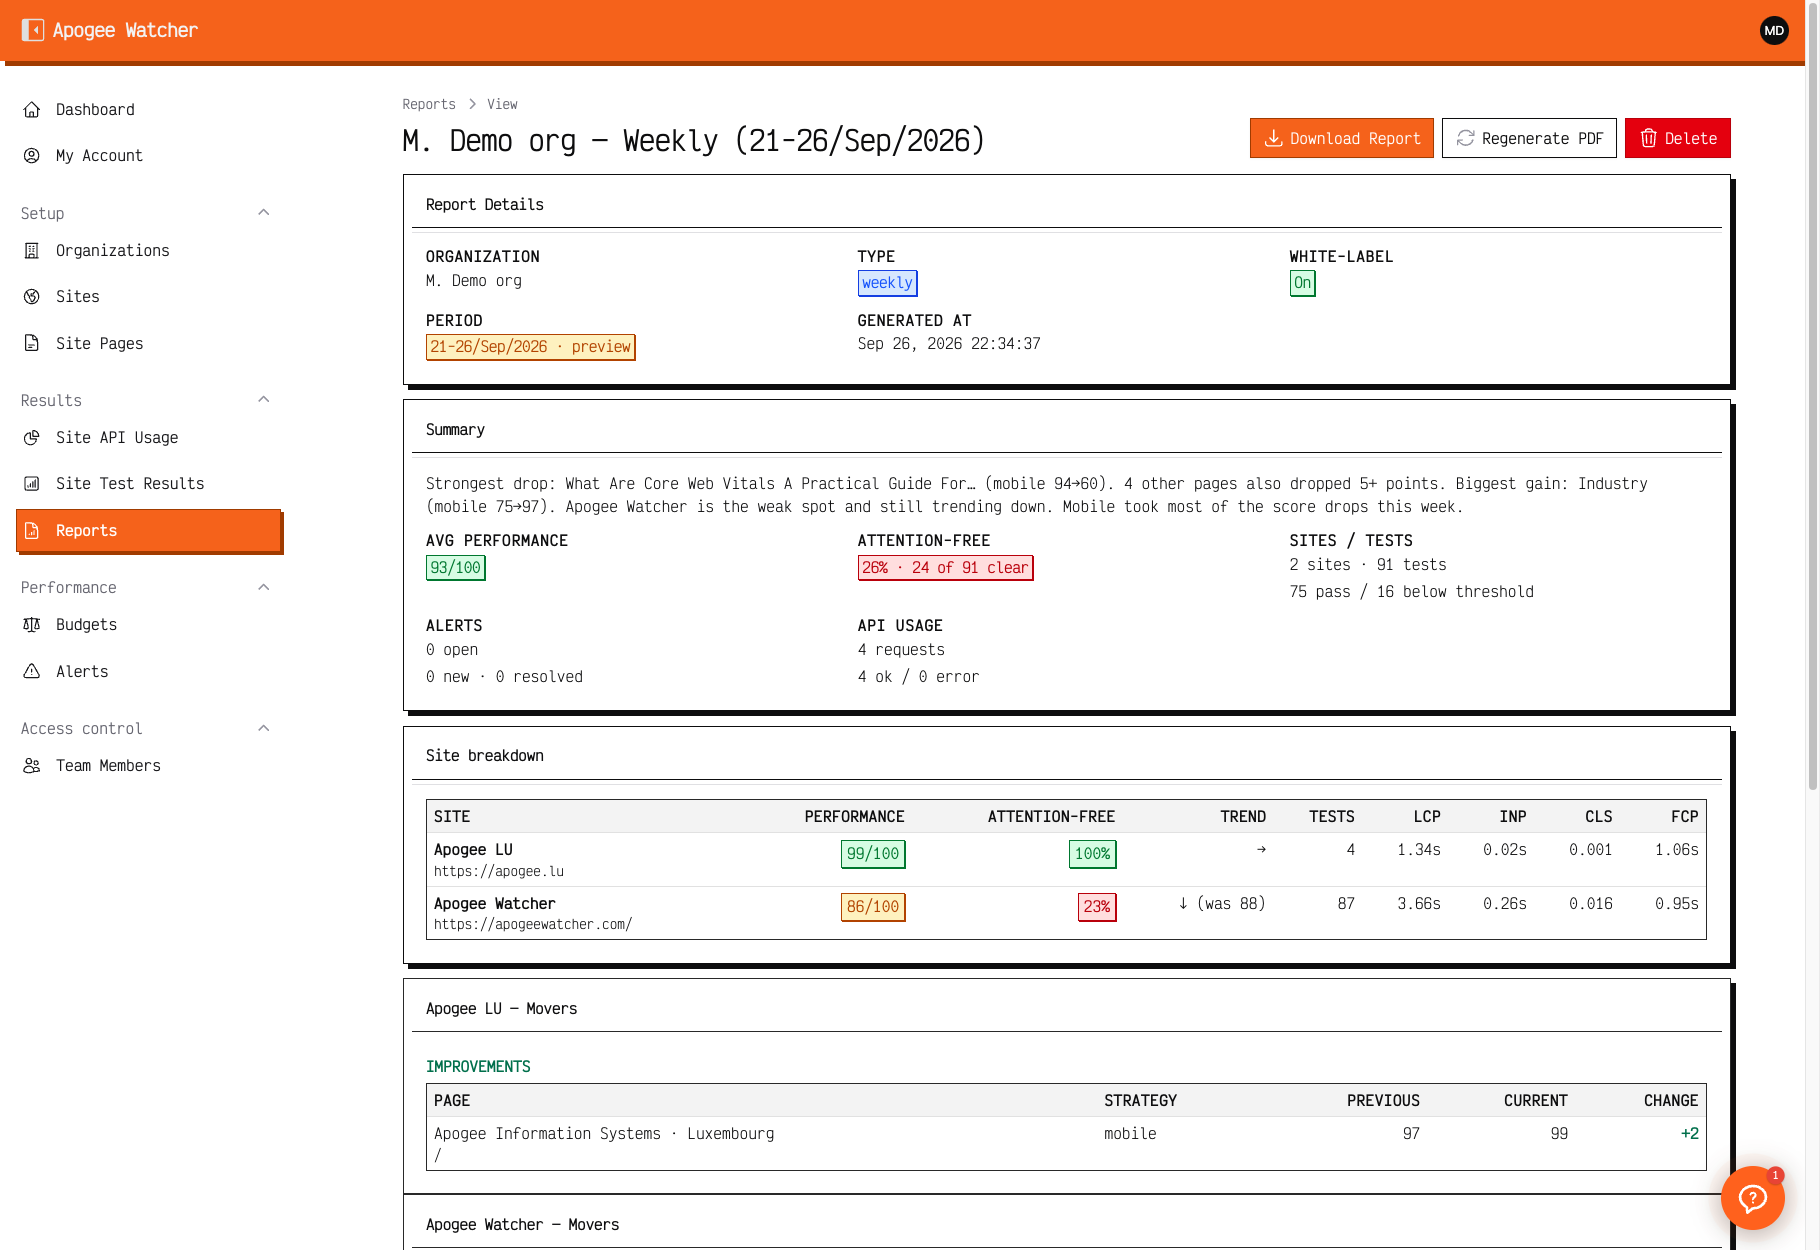
The written summary describes which sites moved, how many alerts opened versus closed, and whether mobile and desktop results diverge. It does not restate every KPI card. Quiet weeks get plain fallback wording. You can Preview the current week from Results → Reports (Monday through today, marked in progress) without sending email. Monday’s job finalises a matching in-progress preview instead of creating a duplicate row for the same period.
PDF download follows the plan’s PDF feature (typically Professional and above). White-label branding applies when the plan includes white-label reports: organisation logo, primary colour, a curated font allowlist safe for PDF export, White-label On/Off, and Regenerate PDF. If white-label is on and no organisation logo is uploaded, PDFs use the Apogee Watcher default logo so the cover is never blank. Regenerating the PDF uses the branding fields that are current on the organisation.
Organisation admins can turn off the weekly email from My Account (Team Memberships), or from the signed unsubscribe link in the mail, while reports still appear under Results → Reports. Monthly and custom report types remain reserved. Slack and webhook delivery for these reports are not part of this release.
Docs: Organisation reports and PDF and White-label reports.
PageSpeed tests behind Cloudflare
Many agency clients put Cloudflare in front of production. When PageSpeed Insights hits a challenge or Turnstile page, the lab score looks like a real failure even though the test never reached the real HTML. Watcher no longer treats that result like a normal low score. We mark the run as blocked, retry when a short wait helps, keep any Chrome UX Report field data that arrived, and leave those failed scores out of site averages.
On Agency workspaces that matters because one protected client site should not lower the organisation’s averages or the dashboard summary. Blocked runs stay visible in history so you can tell a hard block from a genuine Lighthouse regression. If challenges keep appearing, check allowlists, Bot Fight Mode, and whether the origin and the edge return the same content to Google’s test agents. See Cloudflare and PSI Automation.
Domain reports: field data and stable share links
Domain reports now include domain-level Chrome UX Report (field) context beside the lab Summary you already use with clients. Lab numbers answer what Lighthouse saw on this run. Field context answers what Chrome has seen for real users on this origin over the recent window. Showing both on the same Summary makes it clearer that a green lab score and an amber Search Console row can both be correct for different measurement periods.
PDF export again follows the Summary-first layout from Changelog #12. Empty “N/A” rows are omitted from tested-pages tables. The public report view no longer fetches live page titles on every open, which keeps shared links faster.
You can refresh a published domain report without changing its public URL. Links already shared in email or Slack keep working after you regenerate the report. Use refresh when new pages finished testing or when you want Summary and PDF to match the latest completed runs. For Summary triage, see Attention-Free Score on domain reports.
Page discovery and classification on monitored sites
Discovery prefers www when the apex certificate fails or redirects, skips PDF URLs, and treats slash variants of the same path as one page. That reduces duplicate pages that only differ by a trailing slash or by apex versus www.
On site page lists you can Classify selected URLs in bulk with the same page-type set from Changelog #12 (homepage, category, product, cart, checkout, content, legal, and the rest). Mark a batch of product URLs, then raise their test frequency without opening each row. Lead prospecting uses the same type labels when your plan includes lead management.
Site Test results tab
Each monitored site now has a Test results tab for site-wide PageSpeed history. The tab lists completed and failed runs so you can scan timing, strategy (mobile or desktop), and outcome without jumping between page rows.
Same-host pacing notices appear on the Pages and Test results tables instead of in the site header. PageSpeed Insights quota and same-origin pacing still apply; the notice is next to the tables where you start or review runs.
Agency lead tools (organisation-scoped)
Agency and Enterprise plans with lead management can use Lead management, Lead campaigns, Messages, and Lead PSI batches for their own organisation’s prospects. Queues and lists stay limited to that organisation. A Viewer can read; Admin and Manager roles follow the usual organisation permissions for create and edit.
Global system-admin outreach compose and free-check lead admin remain separate. Those tools support our go-to-market work and the public free check funnel, not Agency client prospect lists. See the help centre and pricing for which plan includes lead management.
Sign-in and account access
New and returning users can sign in with Google, or with a magic link (passwordless email login). Self-serve signup no longer waits on a prelaunch list: open /sign-up, create the account, and enter the app. Coupon codes from the Google signup form apply to the account as expected. The Sign in guide covers password, Google, and magic-link paths, including when an invitation email and a magic link arrive for the same address.
Page-level budget violation alert emails send again after we restored the template that the digest layout change had removed. If you use per-page budget mail as well as digests, breach notices resume for new violations without changing budget settings.
Help centre and dashboard polish
The help centre at apogeewatcher.com/docs gained more guides, a Recently updated list on the docs home (newest guides by last review date), a Documentation link in the signed-in user menu, and clearer category hub intros. Basic terms adds a Watcher glossary and Core Web Vitals definitions. Attention-Free Score has its own reports reference that matches the Summary behaviour from Changelog #12.
Additions and updates this month include Getting started (product tour, Sign in); organisations and sites (edit settings, multiple organisations); pages and discovery (how discovery works, priority and frequency); plans and billing (subscription and renewal, read-only when subscription ends); reports (domain performance, organisation reports and PDF, white-label, Attention-Free Score, delete a report); Basic terms; team access (accept invitation, switch organisations); testing (API usage and quotas); and troubleshooting (tests failing or missing, no CrUX data).
Latest test results display cleanly on small screens. Customer dashboard links and metric sizing were adjusted slightly for readability on narrow viewports.
What to try
On an Agency organisation with reporting enabled, open Results → Reports and run Preview mid-week, then confirm Monday’s final report and (if enabled) PDF branding. Opt out of email once from My Account and confirm the report row still appears under Results → Reports.
Run or schedule tests on a Cloudflare-protected client site and confirm blocked runs show as blocked, not as ordinary low scores that lower averages. If blocks continue, follow the allowlist steps in the Cloudflare guide before you treat the lab score as a regression.
Open a shared domain report, note any field (CrUX) context on Summary, refresh from the app, and confirm the same public URL still opens with updated content.
On a monitored site, open the Test results tab, then classify a batch of pages before you change priority or schedule.
If your plan includes lead management, open Lead management for your organisation only and confirm you do not see other organisations’ queues.
Try Google or magic-link sign-in from a clean browser profile. If you use page-level budgets, trigger a test breach on a non-production page and confirm the budget violation email arrives again.
References
Changelog #12: Domain Report Summary, Lead Page Classification, and Classification Rules
Weekly Organisation Reports and White-Label Branding Options Are Live
From Scheduled Tests to White-Label CWV Reports: A Monthly Retainer Workflow
Attention-Free Score: How Domain Reports Show Which Pages Need Work
Cloudflare and PSI Automation: Challenges, Allowlists & Monitoring