Required access: View public link — anyone with the URL · Generate domain report — Manager or Admin
The Attention-Free Score is the headline metric on a domain performance report Summary tab. It answers: how many completed lab tests on this host still need work?
100% means every completed mobile and desktop test on the report passed every Attention-Free gate. Lower percentages mean at least one strategy on at least one page failed a gate.
For how to generate or share the report, see Domain performance reports. For a one-line product definition, see the Watcher Glossary.
What it measures
The score is the share of completed page tests that pass all evaluated gates on that test.
| Term | Meaning |
|---|---|
| Page | A URL included in the domain report |
| Test | One Lighthouse / PageSpeed Insights run for a page × strategy (mobile or desktop). A page with both strategies completed counts as two tests |
| Metric | A value inside a test (Performance score, LCP, CLS, and so on) |
It is not an average of Performance scores across pages. A single weak CLS on one desktop run keeps that test out of the attention-free bucket even when Performance looks fine.
Summary is primarily lab triage. Pair it with Lab data vs field data when clients ask about Chrome UX Report (CrUX) field percentiles.
Attention-Free gates
A test is attention-free only when every gate that could be evaluated is in the good band. Values in needs improvement or poor count as needing attention.
| Gate | Good threshold |
|---|---|
| Lighthouse Performance | ≥ 90 |
| Accessibility | ≥ 80 |
| Best Practices | ≥ 80 |
| SEO | ≥ 80 |
| Largest Contentful Paint (LCP) | ≤ 2.5 s |
| Cumulative Layout Shift (CLS) | ≤ 0.1 |
| Interaction to Next Paint (INP) | ≤ 0.2 s when the lab run records INP |
| Total Blocking Time (TBT) | ≤ 0.2 s (200 ms) when INP is missing — lab fallback for responsiveness |
If a metric is absent on that run, Watcher skips that gate (except the INP → TBT fallback above). Metric definitions: Core Web Vitals definitions.
These Summary gates are fixed on shared domain reports so every link speaks the same language. They are separate from performance budgets you configure for monitored sites and alerts.
How to read the Summary tab
Open a public domain report:
https://apogeewatcher.com/reports/domain/{token}
Summary is the default landing tab (you do not need to append #summary).
Typical Summary content:
- Site status and optional top gap label
- Attention-Free Score (%) plus a headline count such as “12 of 38 tests need attention”
- Dimensions needing attention — fails-only scoreboard (metrics still outside good)
- What we found / optional recommended first action
- Top pages requiring attention (capped) with a Why column naming the failing metric and value
- Attention by page type when classification is available
- Top opportunities merged across mobile and desktop
- Coverage — pages selected, pages with completed tests, tests completed
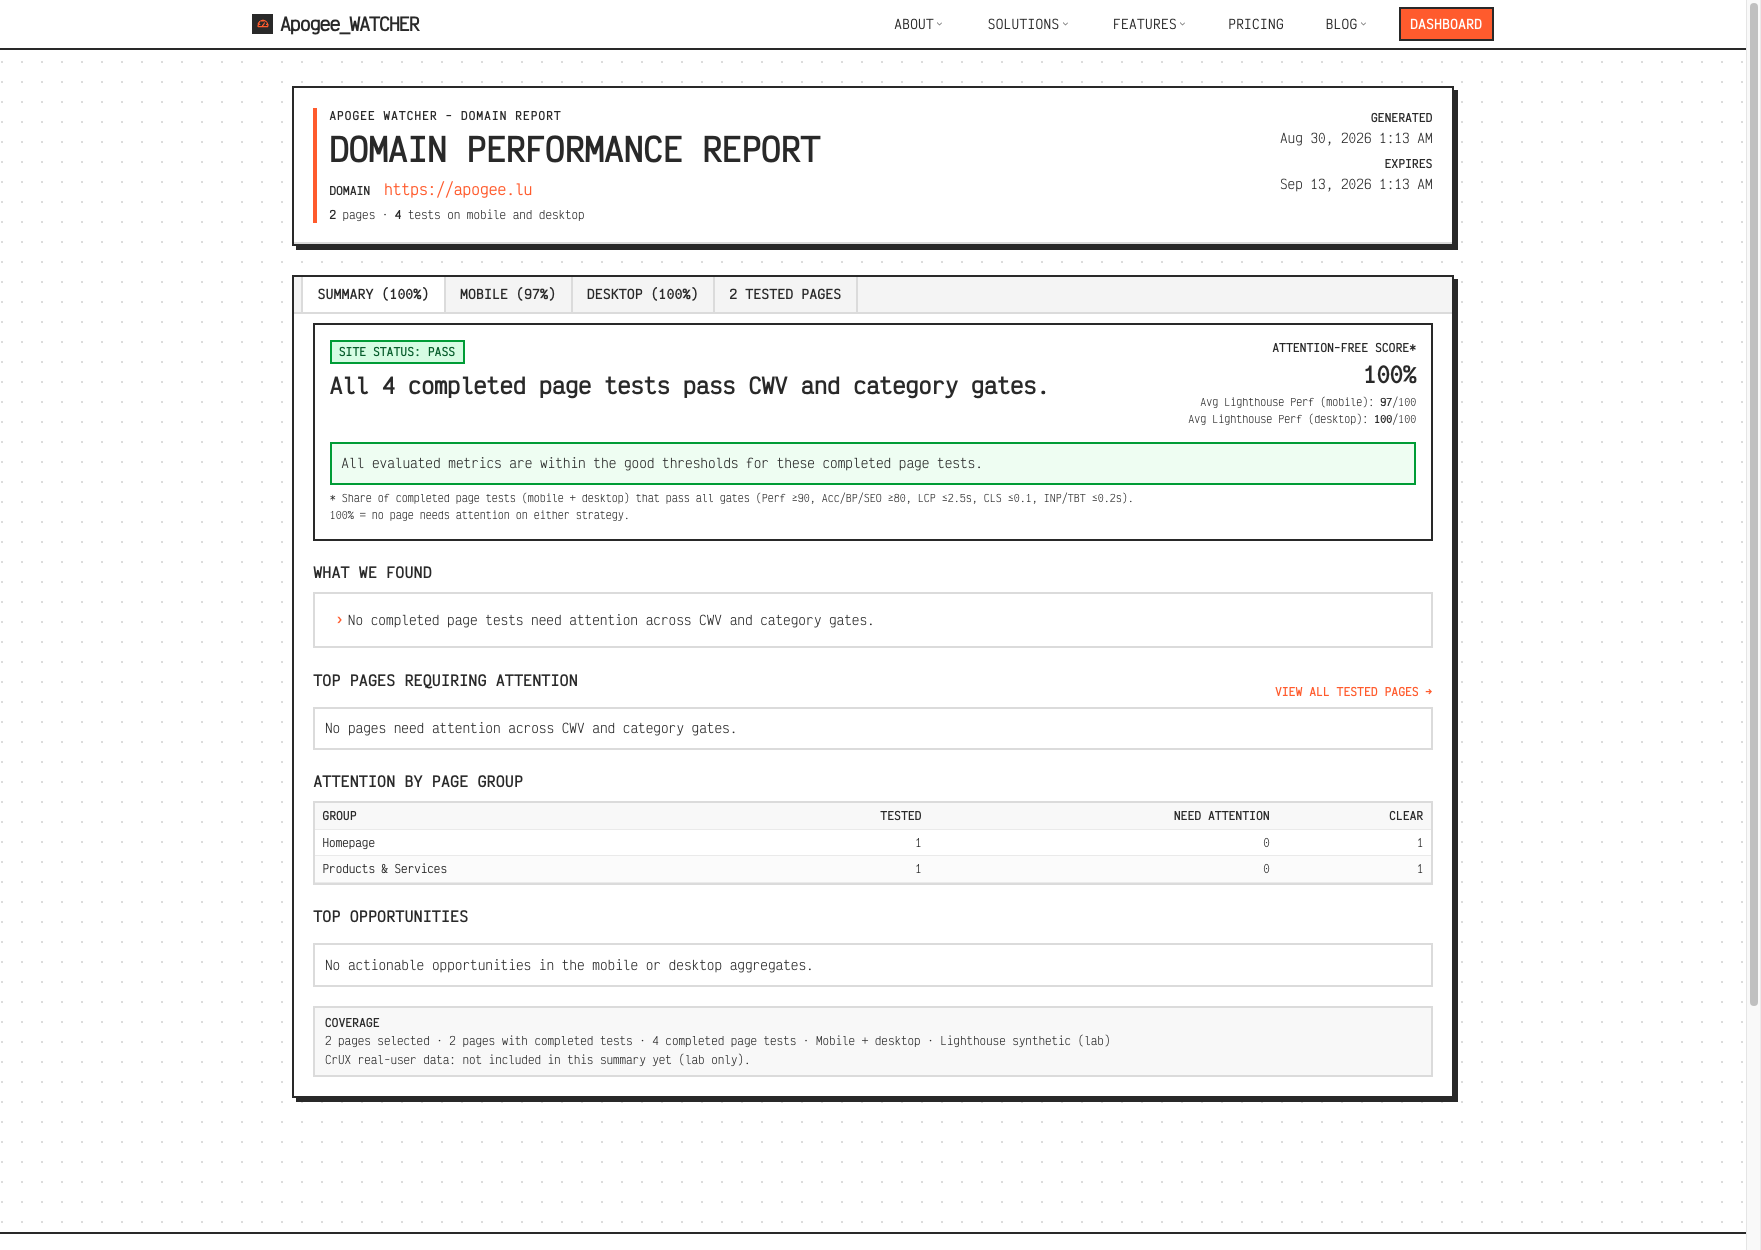 Public domain report Summary — Attention-Free Score and priority list.
Use Mobile, Desktop, and Tested pages when you need full strategy evidence after Summary points you at the right URLs.
Where you see it
Attention-Free Score appears on every public domain report Summary, including:
- Reports generated from a monitored site (Setup → Sites → Reports)
- Free domain scans from
/check - Lead / prospecting domain reports that use the same report shape
Practical tips
- Lead client or prospect email with the score and the “tests need attention” headline, then the top pages table.
- Treat page-type concentration as a template problem (for example product LCP) rather than one-off URL noise.
- After a deploy, regenerate the domain report and compare the score — not as a substitute for CrUX, but as a fast lab roll-up.
- If the score is low because Accessibility or SEO category gates fail while Performance is high, fix those categories before treating the site as “done.”