Required access: Manager or Admin to run manual tests · All roles can view results
Use manual tests to confirm monitoring works before you rely on schedules and alerts. Viewers can open finished results but do not see Run Test actions.
Add site pages first — see Add and discover pages.
Run a single manual test
- Sign in at
/admin. - Open Setup → Site Pages.
- Find the row for the URL you want.
- Click Run Test on that row.
- Confirm in the modal if prompted. The test calls Google PageSpeed Insights and may take up to a minute.
When the run completes, a new row appears for that page and strategy (mobile or desktop) under Results → Site Test Results, and on the site’s Test results tab.
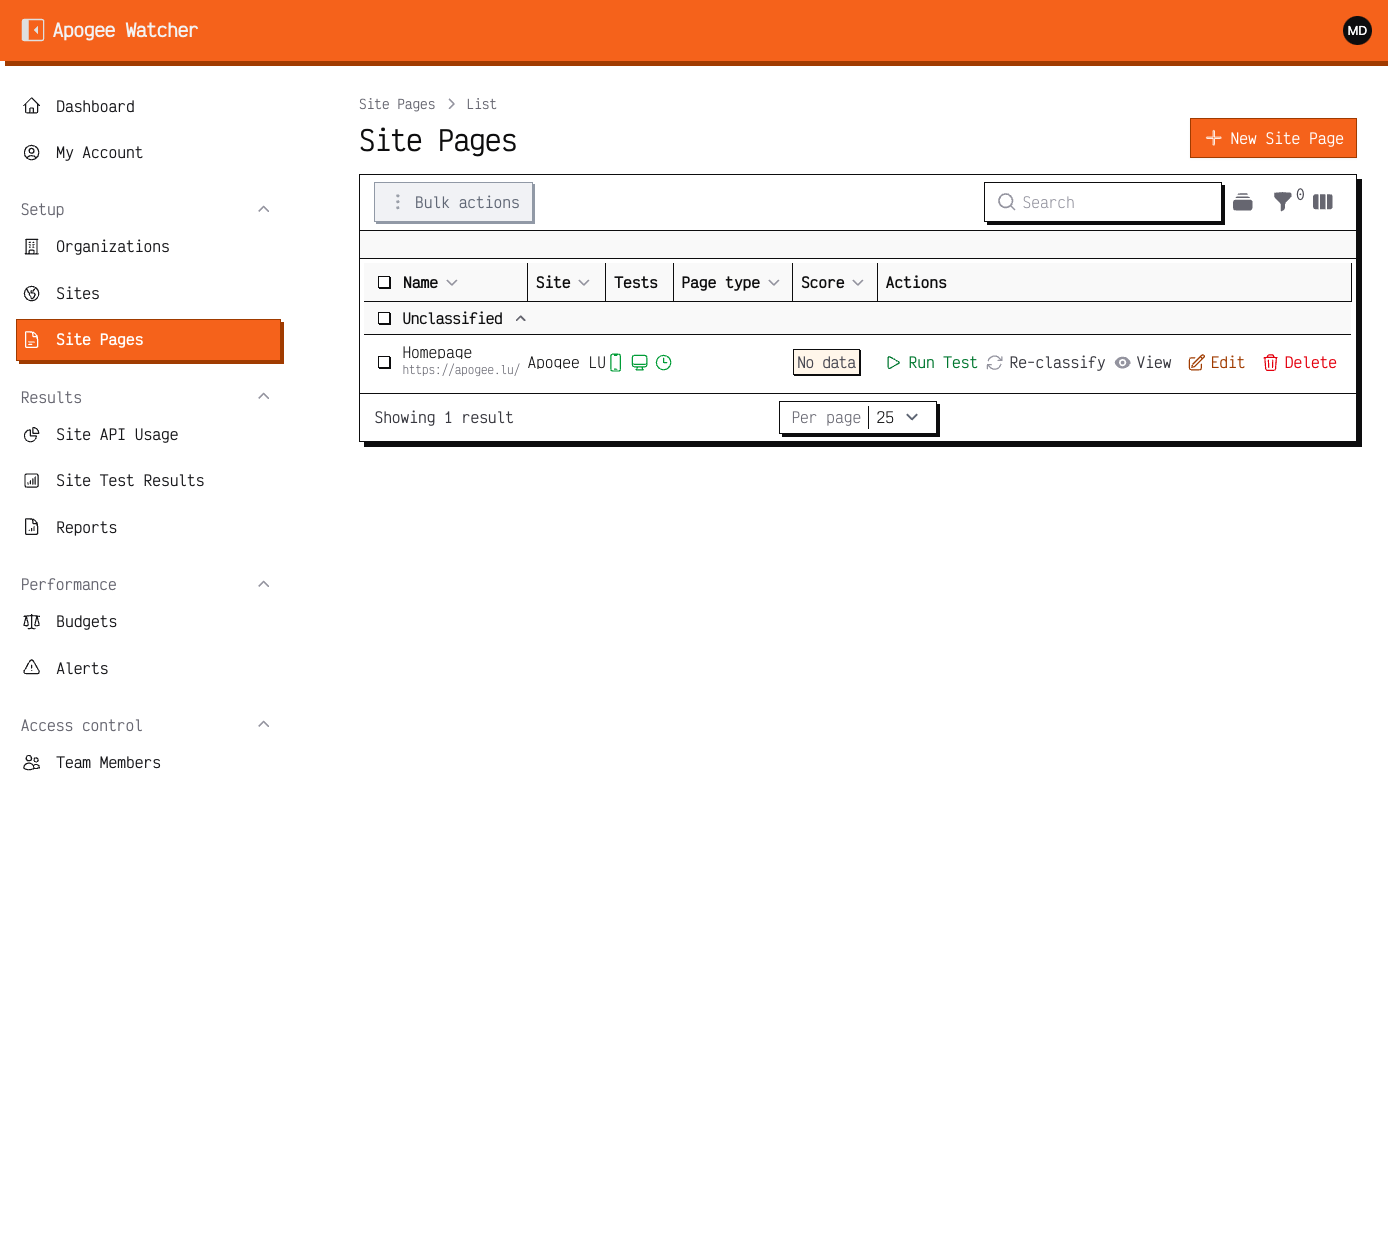 Run Test on a site page row — available to Admin and Manager only.
Run tests in bulk
To baseline several URLs at once:
- Open the site view (Setup → Sites → select site).
- Open the Pages tab.
- Select the checkboxes for active pages you want.
- Choose the bulk Run Tests action and confirm.
Bulk runs consume quota per page and per enabled strategy (mobile and desktop each count when both are active).
Manual tests count toward your organisation’s monthly test quota. Check dashboard plan usage before large bulk runs. See Understand plan limits.
Open and interpret a result
You can open finished runs in either place:
- Results → Site Test Results (all sites), or Setup → Sites → select the site → Test results tab (that site only).
- Filter or sort to find the latest run for your page.
- Open the result row to view the detail page.
The site Test results tab lists the same scores and strategies for that site and may show a host pacing notice when Google PageSpeed is temporarily throttling the hostname.
On the result view you typically see:
| Area | What it shows |
|---|---|
| Performance score | Lighthouse performance score for that run |
| Core Web Vitals | Lab LCP, INP, and CLS for the strategy tested |
| Supporting metrics | FCP, TBT, and other Lighthouse diagnostics where available |
| Field data (CrUX) | Real-user percentiles when Google publishes CrUX for that URL and strategy |
| Charts | History when earlier runs exist for the same page and strategy |
Lab scores reflect the single PSI run you triggered. Field data, when shown, comes from the Chrome UX Report and may lag deploys. See Lab data vs field data.
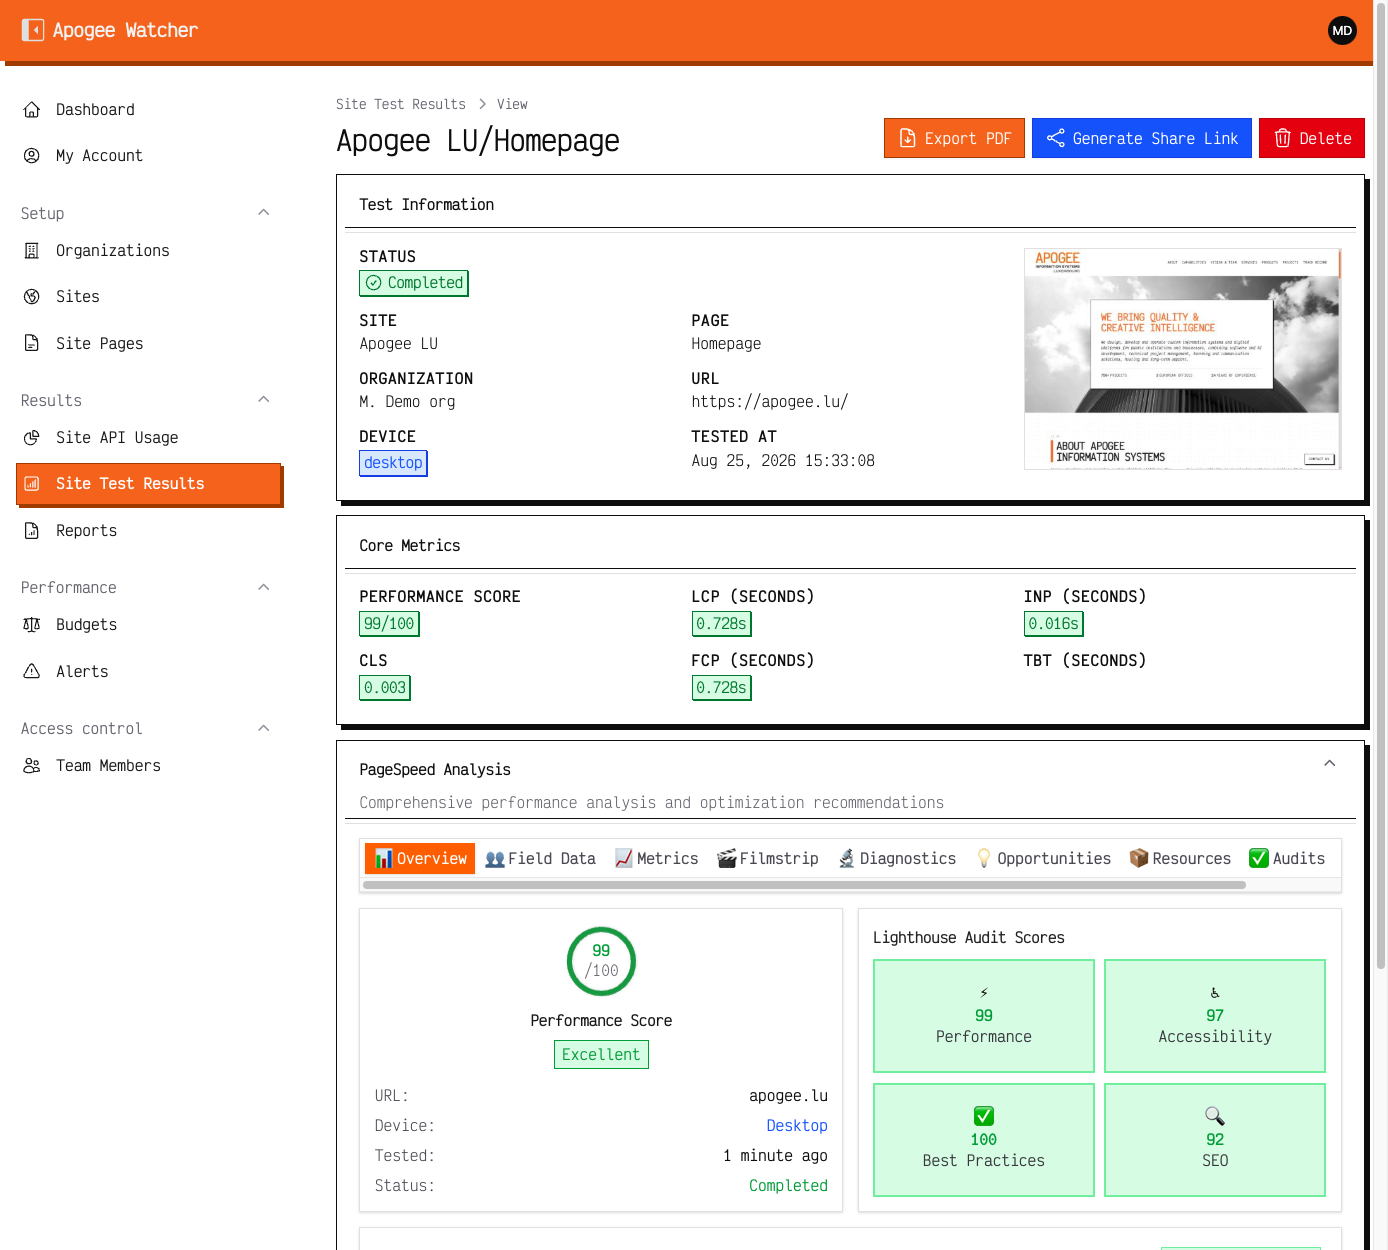 Result detail — scores, vitals, and history for one page and strategy.
Download, export, or share results
From a single result view:
- Use PDF or print actions when available to save a client-ready snapshot.
- Use Share (or copy the public link) to send a read-only URL outside the panel. Details: Share a test result link.
Export several results to CSV
From Results → Site Test Results, or from a site’s Test results tab:
- Select the result rows you want (checkboxes).
- Open the bulk actions menu and choose Export to CSV.
- Download the file. Columns include URL, site, device, performance score, LCP, INP, CLS, FCP, TBT, tested-at time, status, and a link back to the result in the panel.
Viewers can view results, export CSV for selected rows, and open share links. They cannot run tests or delete results.
If a test fails
Common causes:
- URL unreachable from Google’s runners (firewall, geo block, maintenance page)
- Rate limiting or temporary PSI errors
- Invalid URL on the page record
Retry once. If failures persist, contact support with the page URL and timestamp.
After your baseline
- Set performance budgets so regressions trigger alerts — Set performance budgets.
- Confirm scheduled runs are enabled on each priority page.
Viewers do not see Run Test or bulk Run Tests. Assign Manager or Admin if someone must trigger manual runs.